 |
Stratospheric Processes And their Role in Climate
|
||||||||
| Home | Initiatives | Organisation | Publications | Meetings | Acronyms and Abbreviations | Useful Links |
![]()
|
Stratospheric Processes And their Role in Climate
|
||||||||
| Home | Initiatives | Organisation | Publications | Meetings | Acronyms and Abbreviations | Useful Links |
![]()
The Odin satellite was launched on 20 Feb 2001 into a sun-synchronous 18:00 hour ascending node near polar orbit. Odin is a Swedish-led mission in co-operation with Canada, Finland and France using sub-mm spectroscopy for astronomical and atmospheric studies [Murtagh et al., 2002]. This is the first time sub-mm frequencies have been used from space for such studies. Earlier instruments such as the MLS instrument on the Upper Atmosphere Research Satellite [Waters et al., 1996] and the MAS instrument on the Space Shuttle operated at mm-wave frequencies which limits their sensitivity and height resolution for a given antenna size. In addition to the Sub-mm Radiometer (SMR), an Optical Spectrometer and Infrared Imaging System (OSIRIS) is included in the payload to complement and enhance the atmospheric studies. OSIRIS is one of the first limb viewing spectrometers operating in scattered light. Earlier instruments were carried on Solar Mesosphere Explorer [Mount et al., 1986] and the space shuttle [Flitner et al., 2000].
Odin has been designed and built by the Swedish Space Corporation (SSC) as the main contractor to the Swedish National Space Board (SNSB). Platform components have been provided by several of the nations involved. At 240 kg Odin is a small satellite and demonstrates a number of new technological applications including an advanced antenna design based on carbon composites, low power digital auto-correlator spectrometers, an advance 3-axis attitude control system that can point the entire satellite with an accuracy of <10 seconds of arc. The attitude control system is used both for pointing at specific objects in astronomy mode but also to scan the fields of view of the instruments through the earth’s limb. The satellite has no consumables and has full redundancy for all spacecraft systems.
SMR
The sub-mm radiometer consists of 4 tunable sub-mm receivers and 1 mm-wave receiver fixed at 118.7 GHz, three spectrometers and a calibration subsystem. The Schottky mixers are operated at 100 K to reduce noise. A Sterling cycle mechanical cooler provides the cooling. Each sub-mm channel is tunable over 17 GHz but the instantaneous bandwidth is only 1.2 GHz due to the low intermediate frequency of 3.9 GHz. One of the spectrometers is based on acousto-optical techniques with a frequency coverage of 1 GHz and about 1 MHz resolution, the other two spectrometers are hybrid autocorrelators special designed for Odin and consisting of eight correlator chips configurable to provide a number of frequency coverage and resolution combinations. For atmospheric measurements they are normally operated in the 800 MHz mode with 1 MHz resolution. One major advantage of the autocorrelator spectrometers is the possibility to configure each block anywhere within the 1.2 GHz instantaneous band pass of the receivers allowing us to target lines that are near the two extremes of the band pass. Telemetry and power considerations only allow us to operate two spectrometers an any given time so several different operating configurations of the receivers have been designed to address the scientific goals.
OSIRIS
The OSIRIS instrument consists of 2 parts: The spectrometer covering 280-800 nm with 1nm resolution using an aspherical grating, a path bending prism and order sorting filter to create an image of the earth’s limb on a 1353 x 286 element CCD. The field of view of the spectrograph subtends a region 30 km along the limb by 1 km in altitude. Since the OSIRIS instrument requires sunlight, measurements are made only over half of the orbit. Because of the local time of the orbit, OSIRIS makes measurements predominantly in the southern hemisphere during the period late September to late February and in the northern hemisphere for the remaining part of the year. The infrared imager part of OSIRIS is actually three separate co-aligned single lens imagers operating at 1263 nm, 1273 nm and 1530 nm. The spectral regions are selected using interference filters and the imaging is achieved with 1-dimensional InGaAs (128 pixel) linear arrays that are thermoelectrically cooled. Various adaptations of the limb DOAS technique are used to derive species profiles from the optical spectrograph while tomographic methods are used to provide the volume emission profiles of the 1.27 mm emission that may then be related to the distribution of ozone in the sunlit mesosphere following the techniques developed for rocket flights (Evans and Llewellyn, 1972) and the SME spectrometers.
As Odin has a joint astronomy and atmospheric mission, the observation time has been equally divided between the disciplines. To ensure both continuous coverage and provide for campaign-oriented observational periods, the atmosphere is observed every third day with an additional day in each third cycle. Further periods of 1-2 weeks of uninterrupted atmospheric operations can be scheduled in accordance with geophysical conditions. Such periods are available during the boreal and austral springs and in the northern hemispheric summer period. One day of observations (15 orbits) provides global coverage in the sense that all longitudinal ranges have been sampled. Measurements are normally made in the plane of the orbit covering the latitude range 82°S to 82°N.
As mentioned above, the SMR is highly flexible, however a limited number of modes are used in normal operations. On the regular observation days it is operated in the so-called basic stratospheric mode with target gases ozone, chlorine monoxide, nitric acid and nitrous oxide, while the OSIRIS spectrometer measures ozone, nitrogen dioxide, bromine oxide. On the additional days or in campaign mode, the SMR is retuned to make various measurements of water and its isotopomers, odd nitrogen and odd hydrogen species and carbon monoxide.
Retrieval algorithms have been developed for both instruments and in most cases employ an optimal estimation approach. For the SMR, the algorithms have been jointly developed by the groups at Chalmers, the Dept of Meteorology, Stockholm University and the Observatoire de Bordeaux [Eriksson et al., 2002; Baron et al., 2002; Merino et al., 2002]. At least two independent models have been used allowing quality assurance of the algorithm implementations. For the OSIRIS spectrometer measurements the relative novelty of the measurements has inspired a range of modelling and data analysis techniques [McDade et al., 2002; Strong et al., 2002; McLinden et al., 2002; Haley and McDade, 2002; Griffioen and Okarienen, 2002]. Von Savigny et al. [2002] at York University in Toronto have employed a modified version of the algorithm used by Flittner et al. [2000] to retrieve ozone profiles. DOAS techniques have also been used to retrieve ozone and NO2 both in Canada (Sioris et al., 2002) and in Sweden. At the Finish Meteorological Insititute a modified onion peel global fit approach is being developed.
After launch the early operations phase proceeded well and instrument turn on was nominal. Initial problems were encountered with the mechanical cooler but have been solved by running it at a higher power than originally intended and careful management of its thermal environment. In addition, the harmonic oscillator in one of the sub-mm channels failed soon after turn on, which initially seemed to be going to prohibit any measurements in the 575 GHz band, which includes the CO line, but experience has shown that the receiver is sufficiently stable to allow measurements if account is taken of the slow frequency drifts around the orbit. The first atmospheric limb scans were made in May 2001 and the first validation balloons were flown by CNES in June from the Gap launch site (France). Following a period of astronomy commissioning in July, problems were encountered in returning to limb scanning mode in August. While limb scanning was re-established the spacecraft would lose pointing quite often and the problem grew gradually worse until it was impossible to maintain limb scanning mode for a complete orbit during late September and October 2001. The problem was finally traced to a software error and corrected at the end of October with a great improvement in the pointing precision that now more than fulfilled the design requirements.
All of these early problems have complicated and delayed the processing of the data but this is now coming under control. To illustrate the type of data that Odin has been gathering, some examples are given here both of single orbits of data and complete days.
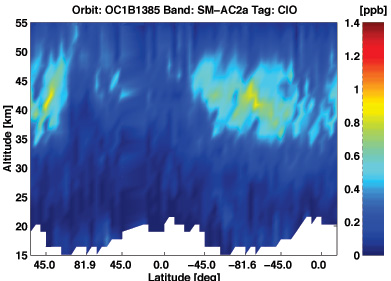
Figure 1 shows the retrieved ClO for a single orbit in Jan 2002. The spacecraft moves northward from the equator to the maximum latitude of 82°N and then back southward to 82°S and back to the equator. The variation of the solar zenith angle at the observation point is also shown. The main ClO peak at around 45 km is clearly seen, as is the expected dependence on local solar illumination conditions. Figure 2 shows the zonal mean N2O distribution, combining 15 orbits of data, on 6 Nov 2001. The decent into the remaining Antarctic polar vortex is clear, as are the equatorial bulge and the edges of the tropical pipe.
 |
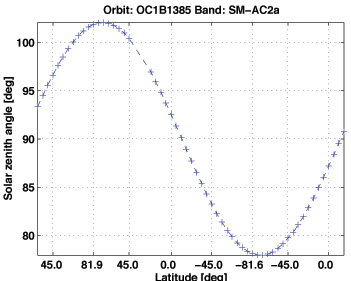 |
| Figure 1: (a): Chlorine monoxide measured by Odin-SMR along a
single orbit in January 2002. (b) The solar zenith angle at the measurement position. Throughout the figures negative and positive latitudes correspond respectively to southern and northern hemisphere [Courtesy C. Jiménez, Chalmers University, Sweden] |
|
|
(For a better resolution of the images, please click on the plot or contact the SPARC Office)
|
|
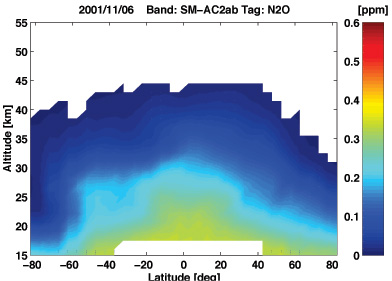 |
| Figure 2: Zonal mean N2O distribution on 6 Nov 2001 from 15 orbits of SMR measurements [Courtesy C. Jiménez, Chalmers, Sweden] |
|
(For a better resolution of the images, please click on the plot or contact the SPARC Office)
|
The OSIRIS instrument provides high quality ozone retrievals using both the modified Flittner method and DOAS. Figure 3 shows the first observations of the ozone hole by OSIRIS derived using the Flittner method on 10 October 2001 despite major problems with the satellite pointing system. Figure 4 shows another example on 11 Nov 2001, this time using a DOAS retrieval and after the satellite pointing problem had been corrected. In both cases the typical lowering of the altitude of the ozone peak with latitude is seen together with the accumulation of ozone outside the vortex edge. The strong depletion of the layer within the vortex is also clear.
 |
| Figure 3: The first observation of the Ozone hole by the OSIRIS instrument on Odin.
Ozone profiles derived using a modified Flittner method. [Courtesy Ch. Von Savigny and C. Haley, York university, Canada] |
|
(For a better resolution of the images, please click on the plot or contact the SPARC Office)
|
 |
| Figure 4: Ozone hole seen in November 2001 by the OSIRIS instrument. Retrieval
using the DOAS method combined with optimal estimation and a single scattering forward model. |
|
(For a better resolution of the images, please click on the plot or contact the SPARC Office)
|
Work is ongoing to validate the products both internally as shown in Figure 5 for ozone and externally using the data from the validation balloon, ozone sondes and the POAM instrument. Comparisons with models are also under way as illustrated in Figure 6, which shows a ClO data from Odin and output from the REPROBUS model sampled at the same local time and locations as the measurements.
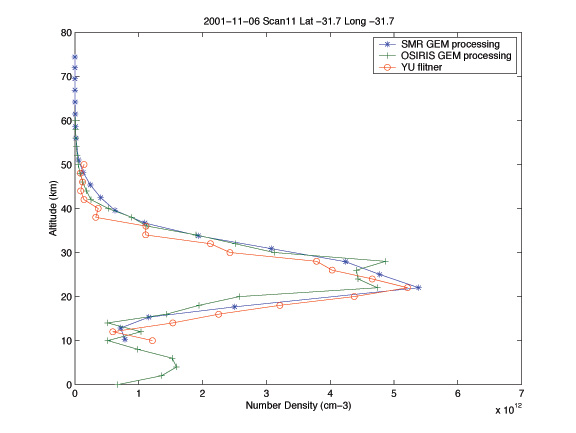 |
| Figure 5: Comparison of Ozone profiles measured by SMR and the OSIRIS instrument. The SMR result is from the ozone line near 501 GHz and the two OSIRIS curves have been derived using two different algorithms: line with circles uses the modified Flittner method (York Univ) and the line with crosses uses the DOAS method and a single scattering forward model (Chalmers). Error analysis is not yet complete so no error bars are shown. |
|
(For a better resolution of the images, please click on the plot or contact the SPARC Office)
|
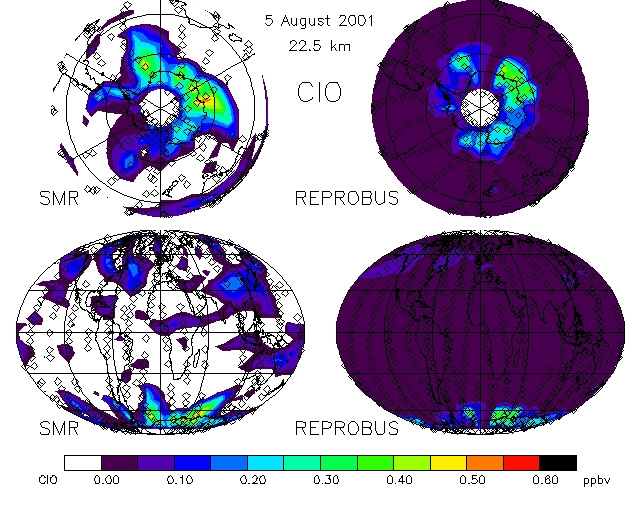 |
| Figure 6: Comparison between the ClO measured by Odin and the Reprobus model
sampled at the same local time and positions as the Odin measurements. Note that the measurements were made with a solar
zenith angle > 90°. [Courtesy Ph. Ricaud, Obs. de Bordeaux and F. Lefèvre, CNRS, Paris] |
|
(For a better resolution of the images, please click on the plot or contact the SPARC Office)
|
After some initial problem the Odin satellite and its two instruments are working well and providing data of the excellent quality that we expected. Data processing is now underway and the products are being subject to validation both internally between the both instrument where possible and against external measurements. We are aiming to have a public product available in time for the coming winters’ VINTERSOL programme organised under the auspices of the EC.
Baron, Ph., et al. Studies for the Odin sub-millimetre radiometer. II. Retrieval methodology, Can J. Phys., 80, 341-356, 2002.
Eriksson, P., et al. Studies for the Odin sub-millimetre radiometer: I. Radiative transfer and instrument simulation, Can J. Phys., 80, 321-340, 2002.
Evans, W.F.J. and E.J. Llewellyn. Measurements of mesospheric ozone from observations of the 1.27µ band, Radio Science, 7, 45-50, 1972.
Flittner D.E, et al. O3 profiles retrieved from limb scatter measurements: Theory, Geophys Res. Lett., 27, 2061-2064, 2000.
Griffioen, E and L Oikarienen, LIMBTRAN: A pseudo three-dimensional radiative transfer model for the limb viewing imager OSIRIS on the Odin satellite, J. Geophys. Res., 105, D24 29717-29730 2000.
Haley C.S. and I.C. McDade. Procedures for recovering mesospheric and stratospheric temperatures from OSIRIS scattered-sunlight measurements, Can J. Phys., 80, 435-442, 2002.
McDade, I.C., et al. A method for recovering stratospheric minor species densities from the Odin/OSIRIS scattered-sunlight measurements, Can J. Phys., 80, 395-408, 2002.
McLinden, C.A., et al. A vector radiative-transfer model for the Odin/OSIRIS project, Can J. Phys., 80, 375-393, 2002.
Merino, F., et al. Studies for the Odin sub-millimetre radiometer: III. Performance simulations, Can J. Phys., 80, 357-373, 2002.
Mount, G.H., et al. Measurements of stratospheric NO2 from the Solar Mesosphere Explorer Satellite 1. An overview of the results, J. Geophys. Res., 89, 1327-1340, 1984.
Murtagh, D., et al. An overview of the Odin atmospheric mission, Can J. Phys., 80, 309-319, 2002.
Sioris et al., Stratospheric profiles of nitrogen dioxide observed by OSIRIS on the Odin satellite, In preparation, J. Geophys. Res., 2002.
Strong, K., et al. Retrieval of vertical concentration profiles from OSIRIS UV–visible limb spectra, Can J. Phys., 80, 409-434 2002.
Von Savigny et al. Preliminary Stratospheric ozone profiles retrieve from limb scattered sunlight radiance spectra measured by the Osiris instrument onboard the Odin satellite. In preparation Geophys Res. Lett., 2002.
Waters, J W, et al. Validation of UARS Microwave Limb Sounder ClO measurements,'' J. Geophys. Res., 101, pp. 10,091-10,127, 1996.
*The Odin team
D. Murtagh3, U. Frisk2, L. Nordh14, F. v. Schéele2, M. Ridal1, A. Jonsson1, J. Stegman1, G. Witt1, P. Eriksson3,
C. Jiménez3, M. Olberg3 G. Megie4, J. de la Nöe5, P. Ricaud5, J. Ramon Pardo6, A. Hauchecorne7, E.J. Llewellyn8,
D.A. Degenstein8, R.L. Gattinger8, N.D. Lloyd8, W.F.J. Evans9, I.C. McDade10, C.S. Haley10, C. Sioris10, C. von Savigny10,
B.H. Solheim10, J.C. McConnell10, K. Strong11, E. Harvey Richardson12, G.W. Leppelmeier13,14, E. Kyrölä13,
H. Auvinen13, and L. Oikarinen13.
Also see http://www.snsb.se/Odin/scientists.htm for the astronomy
team and other important people.
1 - Department of Meteorology, Stockholm University, Stockholm, Sweden
2 - Swedish Space Corporation, Solna, Sweden
3 - Department of Radio and Space Science, Chalmers University of Technology, Göteborg, Sweden
4 - Service d’Aéronomie du CNRS, IPSL-Université Pierre et Marie Curie, Paris, France
5 - Observatoire de Bordeaux, Floirac, France
6 - Astronomy Department, California Institute of Technology, Pasadena, CA, USA
7 - Service d'Aéronomie du CNRS, IPSL, Verrières-le-Buisson, France
8 - ISAS, University of Saskatchewan, Saskatoon, SK, Canada
9 - Physics Department, Trent University, Peterborough, ON, Canada
10 - EATS, York University, North York, ON, Canada
11 - Physics Department, University of Toronto, Toronto, ON, Canada
12 - EHR Associates, Victoria, BC, Canada
13 - Finnish Meteorological Institute, Department of Geophysics, Helsinki, Finland
14 - G & S Associates, Espoo, Finland
15 - Swedish National Space Board, Solna, Sweden
![]()