 |
Stratospheric Processes And their Role in Climate
|
||||||||
| Home | Initiatives | Organisation | Publications | Meetings | Acronyms and Abbreviations | Useful Links |
![]()
|
Stratospheric Processes And their Role in Climate
|
||||||||
| Home | Initiatives | Organisation | Publications | Meetings | Acronyms and Abbreviations | Useful Links |
![]()
George N. Kiladis, NOAA Aeronomy Laboratory, Boulder, Colorado, USA (gkiladis@al.noaa.gov)
Dian J. Seidel, NOAA Air Resources Laboratory, Silver Spring, Maryland, USA (dian.seidel@noaa.gov)
Katherine H. Straub, CIRES, University of Colorado, Boulder, Colorado, USA (kstraub@al.noaa.gov)
It is well known that much of the mass imported into the stratosphere rises through the tropical tropopause (TT). The focus on the TT during the recent SPARC Tropopause Workshop (see Haynes and Shepherd, 2001) reflects increased interest in the need to understand the details of stratosphere-troposphere exchange (STE) processes within the tropics on a variety of timescales. In particular, the study of the relationship between STE and tropical convection has developed renewed momentum given the longer term in situ, reanalysis, and satellite data now available to document this variability.
Despite the mounting recognition that the TT should be considered as a vertical layer rather than a sudden transition between the troposphere and the stratosphere (Highwood and Hoskins, 1998; Gettelman et al., 2001a), the TT is often conveniently defined either as an abrupt change in the lapse rate or as the so-called "cold point" of an atmospheric temperature sounding. This approach greatly simplifies the quantification of the climatology and variability of the TT using observational data.
In this note we attempt to consolidate some recent observations concerning the large-scale relationships between the TT, tropical convection,
and stratospheric conditions on various time scales. For the bulk of the results shown here, the TT was defined according to either the WMO
lapse rate definition or the cold point tropopause (CPT).
Climatological depictions of the TT based on radiosonde data (Makhover, 1979; Seidel et al. 2001) and on reanalyses (Hoinka, 1999;
Randel et al., 2000) reveal a primarily zonally symmetric structure with maximum height and minimum temperature near the equator.
Animated graphic loops of the seasonal variations in TT temperature, pressure, height and saturation mixing ratio, derived from radiosonde data
(Seidel et al., 2001), can be viewed at the SPARC Data Center at: http://www.sparc.sunysb.edu/html/noaa/noaa_trop.html.
A striking feature of these plots is that the TT is highest, coldest, and at its lowest pressure throughout the tropics during Northern Hemisphere
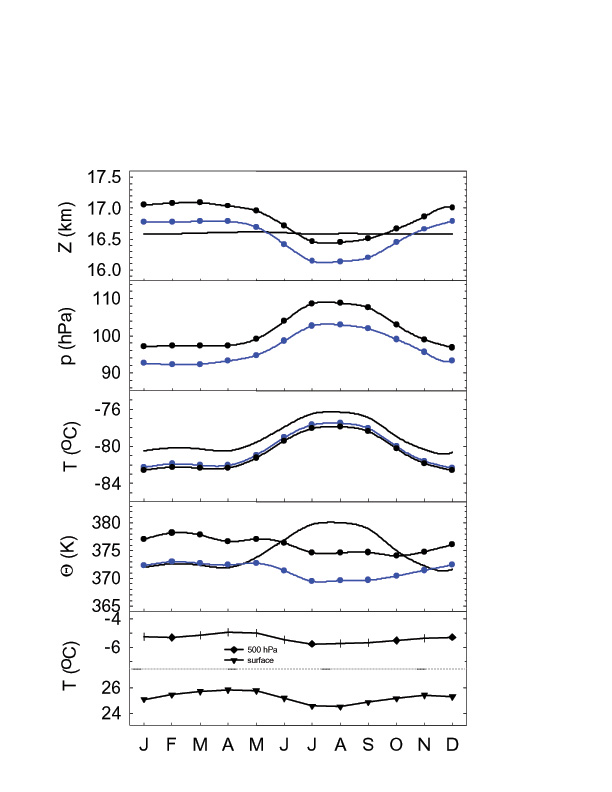
(NH) winter, with the opposite extremes exhibited in NH summer. As depicted in Figure 1, this
seasonality is evident in the equatorial region (10ºN-10ºS), where the amplitude of the zonal-mean annual cycles of the tropopause
temperature, height, and pressure are approximately 5K, 600 m, and 10 hPa, respectively. The annual variations in equatorial mid-tropospheric
(500 hPa) and surface temperature are considerably smaller (about 1K) and show evidence of a semi-annual signal, suggesting that the
seasonality of the TT is not driven by thermal conditions in the underlying troposphere. Seasonal variations in wave-driving, which is
strongest in NH winter and spring, are more likely responsible (Holton et al., 1995; Seidel et al., 2001).
 |
|
Figure 1. Climatological annual cycle of equatorial tropopause characteristics based
on radiosonde data averaged from 10ºN to 10ºS for 1961-1990. The temperature, height, pressure, and potential
temperature are shown for the cold point (black dots), lapse-rate tropopause (blue dots), and the 100 hPa level (thin black curves).
Temperatures at the surface and 500 hPa are also shown for comparison. Adapted from Seidel et al. (2001).
|
|
(please contact the SPARC Office, for a better resolution of the image)
|
Figure 1 also depicts the systematic differences between the TT defined on the basis of the lapse rate
and the cold point. Although the temperature of the two levels is approximately the same, the cold point is located about 300 m higher and its
potential temperature is higher by about 5K than that of the lapse rate tropopause. The 100 hPa level, which has in the past been used as a
convenient surrogate for the TT, does not share the same seasonal variability in height as the TT. With new TT data sets based on reanalysis data
(Randel et al., 2000) and radiosonde data (Seidel et al., 2001) now available via the SPARC Data Center, we advise against the use
of the 100 hPa level in tropopause studies.
Despite its zonal symmetry, there are marked asymmetries about the equator in the mean seasonal cycle, with the tropopause being higher,
colder and at lower pressure in the Northern Hemisphere (NH) than in the Southern Hemisphere (SH) during NH winter. In NH summer, the
tropopause is higher and at lower pressure in the SH, but it remains colder in the NH.
Several recent studies point to the El Niño/Southern Oscillation (ENSO) phenomenon as being a significant factor in interannual variability of
the TT, along with the stratospheric QBO (e.g. Randel et al., 2000; Zhou et al., 2001a). Other, more subtle effects include solar
forcing (van Loon and Labitzke, 1999) and changes in the residual circulation due to interannual variations in extratropical wave driving
(e.g. Salby et al., 2000). To demonstrate the impact of ENSO, we utilise the "Niño 3.4" sea surface temperature
(SST) index, obtained by monthly averaging the SST between 5ºN-5ºS, 170ºW-120ºW, and subtracting from these
values a 1961-1990 climatology. As is well-known, equatorial convection is strongly related to the Niño 3.4 index. During warm events
when SST is anomalously high in the central tropical Pacific, there is enhanced convection over that sector east of 140ºE, with maximum
amplitude just south of the equator near the dateline (Kiladis et al., 2001). A region of suppressed convection is then seen over the eastern
Indian Ocean and Indonesia, extending into the South Pacific Convergence Zone. Nearly opposite conditions are observed during cold events.
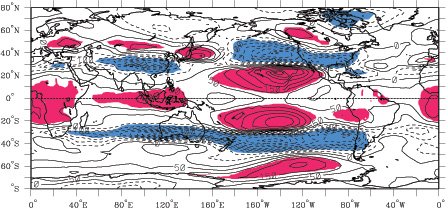
A global view of the response of the tropopause to tropical Pacific SST variations, derived from NCEP/NCAR reanalysis, is shown in Figure 2.
These maps show the simultaneous regression of tropopause height (Ztrop), and temperature (Ttrop) scaled
to a +2.0ºC perturbation in Niño 3.4 SST anomalies for the period from June 1958 through May 1999. Throughout most of the
tropics between about 20ºN and 20ºS, a higher (lower) than normal tropopause accompanies warm (cold) events in Niño 3.4
SST, confirming earlier work of Gage and Reid (1987). Pictures of Ttrop similar to that shown in Figure 2a for Ztrop
were obtained for the tropical belt by Randel et al. (2000), Zhou et al. (2001a), and Gettelman et al. (2001b).
This signal reaches its highest positive amplitude in the subtropical Pacific at 20ºN and 20ºS, and around 140ºW longitude,
with nearly equal amplitude negative perturbations of Ztrop poleward of these locations at 40ºN and 40ºS. To the
west, the negative Ztrop regions shift equatorward to 30ºN and 30ºS, extending from the Atlantic, across the Indian
sector to eastern Asia and Australia.
 |
|
|
Fig.2a
|
|
 |
|
|
Fig. 2b
|
|
| Figure 2. Maps 2a of tropopause height and 2b of tropopause temperature regressed onto Niño 3.4 sea surface temperature (SST) anomalies, using monthly data from 1958–1999. Values are plotted for a +2.0 ºC perturbation in SST. Contour interval is 50 m in (a), and 0.2º C in (b). Positive (negative) perturbations shown as solid (dashed) contours. Red (blue) shading denotes statistically significant positive (negative) perturbations. Adapted from Kiladis et al. (2001). | |
|
(please contact the SPARC Office, for a better resolution of the images)
|
The Ttrop pattern corresponding to Figure 2a is shown in Figure 2b.
While there is a strong zonally-symmetric tropical Ztrop
signal related to ENSO, Ttrop has a much more zonally-varying structure at low latitudes. In fact, as
Figure 2b suggests, the Ttrop difference between Tahiti and Darwin is highly
correlated with the more standard Southern Oscillation Index based on surface pressure at those locations (Randel et al., 2000).
A comparison
of Figures 2a and 2b shows that almost everywhere in
the extratropics where the ENSO signal is manifested, there is a strong negative correlation between Ztrop and Ttrop,
such
that when the tropopause is high (low) it is also cold (warm). This is also true throughout the subtropical and equatorial central and eastern
Pacific. However, despite the higher than normal tropopause over the western Pacific, Ttrop there is actually anomalously warm, as was
observed in the radiosonde data by Reid et al. (1989) and Kiladis et al. (2001). The geographical extent of the region where
the tropopause is high and also warm corresponds closely to the region of suppressed convection centred on Indonesia. This suggests that the
origin of this tropopause warming might be increased upwelled longwave radiation from the surface, since this area is less cloudy than normal
during ENSO warm phases. This mechanism is also consistent with the results of Thuburn and Craig (2000), who imply a sensitivity in the
height of the tropopause to the amount of upwelling longwave radiation.
In Figure 2a, local maxima in tropical geopotential height anomalies occur in the subtropical Pacific
of both hemispheres at 140ºW, the same locations as the minima in Ttrop in Figure 2b. This
is the sector where the anomalous convection over the Pacific sector is associated with the most pronounced enhancement of the local Hadley
circulation, leading to a spin-up of the Pacific subtropical anticyclones. This signal also appears as anticyclonic potential vorticity (PV)
anomalies maximised close to tropopause level (not shown), which are a response to enhanced upper tropospheric mass outflow from the
anomalous equatorial convection. As discussed by Hoskins et al. (1985), anticyclonic PV perturbations in the upper troposphere (UT) lead to
an upward displacement in the tropopause, and require cold temperature anomalies above and warm temperature anomalies below them to
maintain hydrostatic balance, as seen in vertical cross sections of temperature perturbations at these longitudes (Kiladis et al., 2001).
Hydrostatic and PV arguments also provide a convenient framework for considering the tropopause perturbations closer to the equator.
Highwood and Hoskins (1998) studied the large scale response of the tropical tropopause to convective heating through the use of a dry
primitive equations model, in which a heat source was imposed along the equator. This produced subtropical anticyclonic gyres to the west
and a Kelvin response with westerlies to the east of the heat source at upper levels. The vertical structure featured increased (decreased)
pressure in the upper (lower) troposphere, with subsidence and warming of the middle and lower troposphere, and upward motion and cooling
extending through the UT, the tropopause region, and into the lower stratosphere (LS), as is observed.
It seems evident that, on ENSO time scales at least, the large scale pattern of perturbations in the tropopause at most tropical locations can be
explained as a radiative-dynamical response to diabatic forcing by the anomalous SST distribution. Given the results of Salby
et al. (2000), however, we cannot discount the possibility that "downward control" principles may be of some importance
to the details of the distribution. Further study of the fine structure of these perturbations may help in better quantifying the relative
importance of diabatic and dynamical effects on the tropopause.
It has long been known that the TT responds significantly to the passage of equatorially-trapped disturbances in the LS. Recent work has shown
that large perturbations in temperature in the LS and at the tropopause level are associated with convectively coupled waves propagating zonally
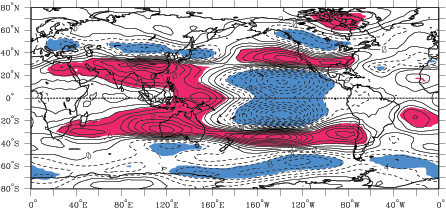
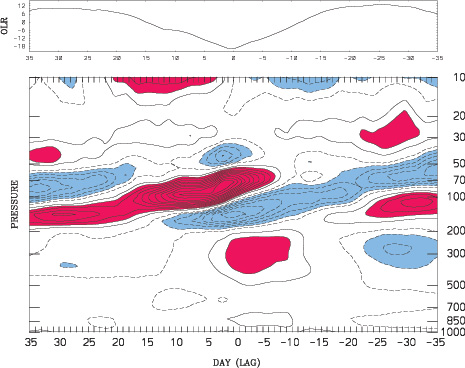
along the equator (Wheeler et al., 2000; Kiladis et al., 2001; Straub and Kiladis, 2001). Figure
3 shows time-height cross sections of temperature perturbations from radiosonde data at Singapore associated with the passage
of two important convectively-coupled equatorial disturbances, the Madden-Julian Oscillation (MJO) and Kelvin waves.
Figure 3b was produced by regressing Singapore temperature data against an index of the
MJO obtained by combining the first two EOFs of 120-day high-pass filtered outgoing longwave radiation (OLR) between 20°N and 20°S.
Figure 3a was obtained in a similar way except by using space-time filtering OLR to retain only fluctuations in the Kelvin wave band (see Wheeler
and Kiladis, 1999). Both plots are scaled to a -20 Wm-2 perturbation in OLR on Day 0, which is a typical value of a perturbation associated with
these disturbances as they pass by the station.
 |
|
Fig. 3a
|
 |
|
Fig. 3b
|
Figure 3. Outgoing longwave radiation (OLR) and time-height temperature perturbations from Singapore radiosonde data regressed against (a) a Kelvin wave index (see text) for December-February 1979-1999 and (b) a Madden-Julian Oscillation index. The perturbations have been scaled to a -20 Wm-2 anomaly in OLR at the station at simultaneous lag (Day 0). Lags are in days, with time going from right to left, and data have been plotted on pressure surfaces. Contour interval is 0.1º C. Red (blue) shading denotes positive (negative) perturbations. |
|
(please contact the SPARC Office, for a better resolution of the images)
|
In both disturbances, the largest temperature perturbations are observed around the TT, extending vertically in wavelike perturbations into the
LS. For the Kelvin wave (Figure 3a), the largest negative temperature perturbation at the TT (near
100 hPa at this location) occurs 2 days prior to the passage of the convection, with a peak positive perturbation occurring two days following the
convective signal. For the MJO (Figure 3b), the sequence is similar but the perturbations are even larger,
and the peak TT perturbations occur more than a week prior to and following the convective peak. In fact, the TT temperature perturbation is near
zero when convection is maximised at Singapore for both disturbances.
This vertical structure is consistent with the forcing of vertically propagating energy by an upper tropospheric energy source provided by the
convective heating associated with the disturbance. For an upper tropospheric source moving eastward along the equator, temperature phase
lines should tilt upward and eastward above the source, as in a vertically propagating gravity wave (Andrews et al., 1987). A zonal
cross section of the MJO temperature perturbation along the equator (Figure 4), derived from
ECMWF reanalysis data, is consistent with this implied structure. The Kelvin wave shows similar structure although at a smaller spatial scale
(Wheeler et al., 2000). In Figure 4 upward and eastward tilting phase lines are seen well to
the east of MJO convection, leading by more than 20 degrees of longitude. The time evolution of this signal (not shown) reveals that the entire
perturbation pattern shifts eastward at between 5-10 ms-1 for the MJO, while in the Kelvin wave, the phase speed is somewhat faster, at
around 15 ms-1. Thus TT perturbations, as well as any potential STE mechanisms that might be dependent on the vertical motion associated
with these waves, while substantial, are not collocated with local convection. Fujiwara et al. (1998) found convincing evidence of the
STE of ozone associated with Kelvin waves and possibly the MJO, inferred from radiosonde and ozonesonde data over Indonesia. For the
Kelvin wave the relationship was such that maximum upper tropospheric ozone concentrations occurred during periods of anomalously low
tropopause and downward propagating warm temperature perturbations, implying downward transport from the stratosphere across the
tropopause due to the dynamical structure of the wave. Temperature fluctuations in the TT region due to Kelvin waves have also been
implicated in cirrus cloud formation at that level (Boehm and Verlinde, 2000).
While the largest TT perturbations are generally observed at some distance away from the deepest convection coupled to equatorial waves,
there is ample evidence that local convection can penetrate through the TT into the LS (Gettelman et al., 2001b). The precise nature of the
impact of this higher frequency convection on the TT and in STE, and in particular its role in the dehydration of the stratosphere, is an area of
active research (Sherwood, 2001).
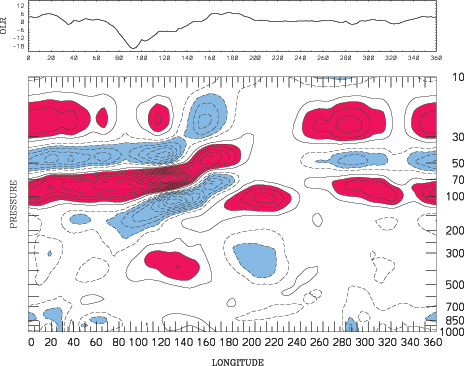 |
| Figure 4. As in Figure 3, but a longitude-pressure plot of temperature along the equator on Day 0 from December-February 1979-93 ECMWF reanalysis data versus the MJO index. Contour interval is 0.1º C. |
|
(please contact the SPARC Office, for a better resolution of the image)
|
Distinct quasi-biennial oscillations (QBO) of the TT have long been recognised (Angell and Korshover, 1974; Reid and Gage, 1985) and reveal a
certain level of control over the TT by the equatorial stratosphere. Randel et al. (2000) find that the QBO explains about 12% of the
interannual variance in TT temperature and height, with higher equatorial tropopause temperatures associated with westerly QBO winds in the
equatorial stratosphere. In the subtropics, TT QBO temperature variations are of opposite sign to equatorial signal.
Using ECMWF reanalysis data, Zhou et al. (2001a) clearly depict the zonally symmetric structure of the QBO signal in the cold-point
tropopause (Figure 5). Here the zonal wind shear at 50 hPa over Singapore is taken as an index of
the QBO in equatorial lower stratospheric winds. Zhou et al. (2001a) find that the TT anomalies lag the QBO by about six months,
suggesting a downward-propagating signal consistent with the dynamics of the QBO.
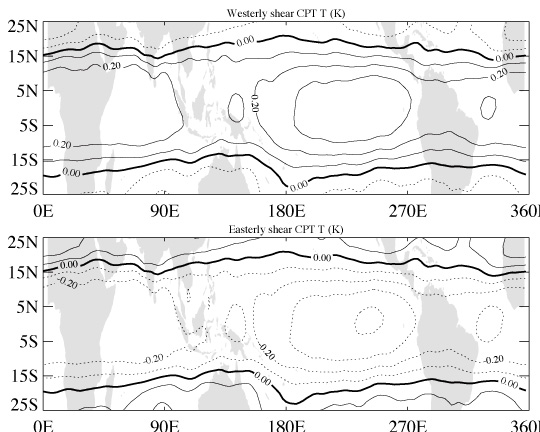 |
| Figure 5. Composite analyses of CPT temperatures under westerly and easterly stratospheric zonal wind shear conditions. Winds at 40 and 70 hPa at Singapore were used to estimate 50 hPa wind shear. Note that the shears lead the CPT temperatures by six months. Contour interval is 0.1º C. Adapted from Zhou et al. (2001a). |
|
(please contact the SPARC Office, for a better resolution of the image)
|
The long-term variability of the TT is not well understood. Suggestions of a solar cycle influence on the TT have been made (Reid and Gage,
1985; van Loon and Labitzke, 1999), but these signals are much less significant than the temperature signals in the LS observed to be associated
with the solar cycle. Large volcanic eruptions warm the stratosphere, and these also may influence TT characteristics, but observational evidence
is limited. Randel et al. (2000) identify a warming and lowering of the TT following the 1982 eruption of El Chichón, but the larger
1991 Pinatubo eruption appears to have had a less notable influence.
Figure 6 shows temperature variations from radiosonde data in the 15°S to 15°N latitude
band at the TT and at three other levels, along with tropopause height variations. Compared with the troposphere and surface, the TT
temperature shows much larger interannual variability, although not quite as much as the LS (18 km level). The variations in TT temperature
are also much more highly correlated with LS temperature (r = 0.74) than with surface (r = -0.01) or tropospheric (r = 0.13) temperature.
On the other hand, the height of the tropopause covaries both with stratospheric temperature (r = -0.80) and tropospheric temperature
(r = 0.49).
A number of recent studies have attempted to evaluate multi-decadal trends in the TT, motivated largely by the need to determine whether
recently identified increases in stratospheric water vapour (SPARC, 2000; Rosenlof et al., 2001) can be explained in terms of changes
in the TT. Unfortunately, existing data sets are not well suited to TT trend detection. Reanalysis data are severely affected by changes in the
available observational data, particularly the introduction of satellite observations in 1979 (Randel et al., 2000). Radiosonde data are
affected by instrument changes that compromise the long-term homogeneity of the observations (Seidel et al., 2001). Nevertheless,
three recent studies (Randel et al., 2000, Seidel et al., 2001, Zhou et al., 2001b) find suggestions of a cooling of the TT
since the 1970’s, as indicated in Figure 6. The downward trend in tropopause temperature,
of about 0.5K/decade, is consistent with the cooling of the stratosphere (Ramaswamy et al., 2001) and opposes the marked surface warming,
of about 0.15K/decade, in this region. The TT cooling is associated with a decrease in stratospheric entry-level saturation water vapour
mixing ratio and so does not explain the observed water vapour trends. However, other changes, perhaps in the areal extent and frequency
of STE or in the magnitude of the mass flux through the TT, may play important roles and certainly merit further study.
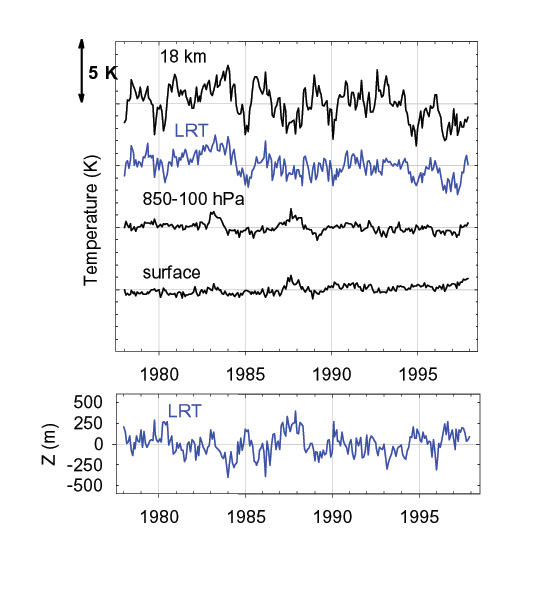 |
| Figure 6. Monthly anomalies of temperature at 18 km, at the lapse rate tropopause (LRT), in the 850-100 hPa layer, and at the surface, averaged from 15ºN-15ºS, for 1978-1997 based on radiosonde observations. Adapted from Seidel et al. (2001) |
|
(please contact the SPARC Office, for a better resolution of the image)
|
This brief overview highlights the complex nature of the TT region and various aspects of TT variability over a wide range of timescales.
This variability appears to manifest elements of tropospheric changes, such as those related to the location and timing of convection on ENSO
and intraseasonal time scales, as well as stratospheric variations such as the QBO and volcanic influence. The zonal symmetry along with
asymmetries about the equator of the annual cycle seem to be driven by stratospheric processes, and recent downward trends in TT temperature
are consistent with stratospheric cooling. Furthering our understanding of the nature of TT variability will require advances in both observations
and theory.
Small time and space scale variations in the TT have received less attention to date, probably due to the lack of data with adequate resolution.
Such observations are needed to better delineate the diurnal and day-to-day variations in the tropopause, which are not well documented.
A better understanding of possible TT variations on small spatial scales would shed light on the nature of stratosphere-troposphere exchange,
particularly of water vapour. The current radiosonde network, which is particularly sparse in the tropics, cannot resolve variations with
length scales of order 1000 km or less.
Increased spatial coverage by radiosondes and other in situ sensors will be necessary to isolate the finer structure of TT variations. The
detection of TT trends will rely primarily on continuous, high quality, long-term sounding data. Satellite observations with improved vertical
resolution near the TT would also help to fill these needs, but current sounding techniques do not yet provide the resolution afforded by
radiosondes. Coordinated meteorological and chemical measurements are also needed to enable progress in STE research.
The development of models with complete coupling of the stratosphere and troposphere is progressing. Given the observed associations of the
TT with tropical waves, future models will have to display reasonably adequate spectra of tropical disturbances, down to the high frequency
gravity waves responsible in part for driving the QBO. This in turn will require continued improvements in the parameterisation of radiation
and convection. Further advances in the coupling of interactive chemistry will be necessary to simulate details of STE processes, and to assess
the extent of the impacts of various global change scenarios. While great progress has been made in this type of model development over the
past few years, as stated by Haynes and Shepherd (2001), this subfield is "still in its infancy". The successful melding of the
observational, theoretical, and modelling aspects of the TT and associated STE processes poses a particularly daunting cross-disciplinary
challenge.
Andrews, D.G., J.R. Holton, and C.B. Leovy, 1987: Middle Atmosphere Dynamics. Academic Press, 489 pp.
Angell, J.K., and J. Korshover, 1974: Quasi-biennial and long-term fluctuations in tropopause pressure and temperature, and the relation to stratospheric water vapour, Mon. Weather Rev., 102, 29-34.
Boehm, M.T., and J. Verlinde, 2000: Stratospheric influence on upper tropospheric tropical cirrus. Geophys. Res. Lett., 27, 3209-3212.
Fujiwara, M., K. Kita, and T. Ogawa, 1998: Stratosphere-troposphere exchange of ozone associated with the equatorial Kelvin wave as observed with ozonesondes and rawinsondes. J. Geophys. Res., 103, 19,173-19,182.
Gage, K.S. and G.C. Reid, 1987: Longitudinal variations in tropical tropopause properties in relation to tropical convection and ENSO events. J. Geophys. Res., 92, 14197-14203.
Gettelman, A., M.L. Salby, W.J. Randel, and F. Sassi, 2001a: Convection in the tropical tropopause region and stratosphere-troposphere exchange. SPARC Newsletter, 17, 22-25.
Gettelman, A., W.J. Randel, S. Massie, F. Wu, W.G. Read, J.M. Russell III, 2001b: El Niño as a natural experiment for studying the tropical tropopause region. J. Climate, 14, 3375-3392.
Haynes, P.H., and T.G. Shepherd, 2001: Report on the SPARC Tropopause Workshop. SPARC Newsletter, 17, 3-10.
Highwood, E.J., and B.J. Hoskins, 1998: The tropical tropopause. Quart. J. Roy. Met. Soc., 124, 1579-1604.
Hoinka, K.P., 1999: Temperature, humidity, and wind at the global tropopause. Mon. Wea. Rev., 127, 2248-2265.
Holton, J., P. Haynes, M. McIntyre, A. Douglass, R. Rood, and L. Pfister, 1995: Stratosphere-troposphere exchange. Rev. Geophys., 33, 403-439.
Hoskins, B.J., M.E. McIntyre, and A.W. Robertson, 1985: On the use and significance of isentropic potential vorticity maps. Quart. J. Roy. Met. Soc., 111, 877-946.
Kiladis, G.N., K.H. Straub, G.C. Reid, and K.S. Gage, 2001: Aspects of interannual and intraseasonal variability of the tropopause and lower stratosphere. Quart. J. Roy. Meteor. Soc., 127, 1961-1984..
Makhover, Z. M., 1979: Features of the tropopause distribution over the globe, Meteor. Gidrol., 12, 33-39, (in Russian).
Ramaswamy, V., M.-L. Chanin, J. Angell, J. Barnett, D. Gaffen, M. Gelman, P. Kekhut, Y. Koshelkov, K. Labitzke, J.-J. R. Lin, A. O’Neill, J. Nash, W. Randel, R. Rood, K. Shine, M. Shiotani, and R. Swinbank, 2001: Stratospheric temperature trends: Observations and model simulations. Rev. Geophys., 39, 71-122.
Randel, W.J., F. Wu, and D.J. Gaffen, 2000: Interannual variability of the tropical tropopause derived from radiosonde data and NCEP reanalysis. J. Geophys. Res., 105, 15,509-15,523.
Reid, G.C., and K.S. Gage, 1985: Interannual variations in the height of the tropical tropopause, J. Geophys. Res., 90, 5629-5635.
Reid, G.C., K.S. Gage, and J.R. McAfee, 1989: The thermal response of the tropical atmosphere to variations in equatorial Pacific sea surface temperature. J. Geophys. Res., 94, 14705-14716.
Rosenlof , K.H., S.J. Oltmans, D. Kley, J.M. Russell III, E-W. Chiou, W.P. Chu, D.G. Johnson, K.K. Kelly, H.A. Michelsen, G.E. Nedoluha, E.E. Remsberg, G.C. Ton, M.P. McCormick, 2001: Stratospheric water vapour increases over the past half-century. Geophys. Res. Lett., 28, 1195-1198.
Salby, M.L., P. Callaghan, P. Keckhut, S. Godin, and M. Guirlet, 2000: Interannual changes of temperature and ozone. SPARC Newsletter, 15, 6-11.
Seidel, D.J., R.J. Ross, J.K. Angell, and G.C. Reid, 2001: Climatological characteristics of the tropical tropopause as revealed by radiosondes. J. Geophys. Res., 106, 7857-7878.
Sherwood, S., 2001: Recent insights into the regulation of water vapour entering the stratosphere. SPARC Newsletter, 17, 26-29.
SPARC Report N°2 : SPARC Assessment of Upper Tropospheric and Stratospheric Water Vapour, WCRP N° 113,
WMO/TD-N° 1043 (December 2000).
Straub, K.H., and G.N. Kiladis, 2001: Observations of a convectively-coupled Kelvin wave in the eastern Pacific ITCZ.
J. Atmos. Sci. (in press).
Thuburn, J. and G.C. Craig, 2000: Stratospheric influence on tropopause height: The radiative constraint. J. Atmos. Sci., 57, 17-28.
van Loon, H., and K. Labitzke, 1999: The signal of the 11-year solar cycle in the global stratosphere. J. Atmos. Solar-Terr. Phys., 61, 53-61.
Wheeler, M., and G.N. Kiladis, 1999: Convectively-coupled equatorial waves: Analysis of clouds in the wavenumber-frequency domain. J. Atmos. Sci., 56, 374-399.
Wheeler, M., G.N. Kiladis, and P.J. Webster, 2001: Large-scale dynamical fields associated with convectively-coupled equatorial waves. J. Atmos. Sci., 57, 613-640.
Zhou, X.L., M.A. Geller, and M.H. Zhang, 2001a: Tropical cold point tropopause characteristics derived from ECMWF reanalyses and soundings. J. Climate, 14, 1823-1838.
Zhou, X.L., M.A. Geller, and M. Zhang, 2001b: Cooling trend of the tropical cold point tropopause temperatures and its implications, J. Geophys. Res., 106, 1511-1522.
![]()