 |
Stratospheric Processes And their Role in Climate
|
||||||||
| Home | Initiatives | Organisation | Publications | Meetings | Acronyms and Abbreviations | Useful Links |
![]()
|
Stratospheric Processes And their Role in Climate
|
||||||||
| Home | Initiatives | Organisation | Publications | Meetings | Acronyms and Abbreviations | Useful Links |
![]()
V. Ramaswamy, NOAA/ GFDL, Princeton, USA (vr@gfdl.gov)
Melvyn E. Gelman, NOAA/ NCEP/ CPC, Washington, D. C. (Melyn.Gelman@noaa.gov)
M. Daniel Schwarzkopf, NOAA/ GFDL, Princeton, USA (ds@gfdl.noaa.gov)
J.-J. R. Lin, NOAA/ NCEP/ CPC, Washington, D. C. (roger.lin@noaa.gov)
The SPARC stratospheric temperature trends analyses have now been extended
through to the year 2000. This represents an update of the work reported in WMO (1999) and Ramaswamy et al. (2001). While a
focus
in the earlier work was on the trends over the period 1979-1994, we present in this paper updated trends for the period 1979-2000,
and compare the changes in the decadal-scale trend estimates for the two time periods.
In contrast to the data available from various platforms for evaluating the 1979-1994 trends, SPARC updates beyond 1994 have been
made possible for the Angell, Berlin and Russia sonde data sets, the (Nash) SSU and MSU satellite data sets, and the CPC analyses
(see Ramaswamy et al., 2001, for a description of the various data sets). The SSU time series extends only through 1998.
Also, the SSU data extends only up to ~70 degrees latitude in contrast to MSU which extends to 90 degrees. We summarise the trend
results from the latest analyses performed as part of SPARC Stratospheric Temperature Trends Assessment (STTA), following
closely the style of discussions reported in the earlier work. Updated trends estimates are computed using the maximum likelihood
estimation methodology, in the same manner employed earlier to determine the 1979-1994 trends. The methodology consists of
fitting the time series of monthly-mean values with a constant and six variables (annual and semi-annual sine, annual and semi-annual
cosine, solar cycle and linear trend). The derived trend and standard error are the products of the computation. We describe here the
estimates of the mean trends and the 2-sigma uncertainties resulting from the STTA analyses. As pointed out in the earlier paper,
estimates of statistical uncertainties could be more sensitive to de-tails of the trends determination method employed than the mean
trend results themselves.
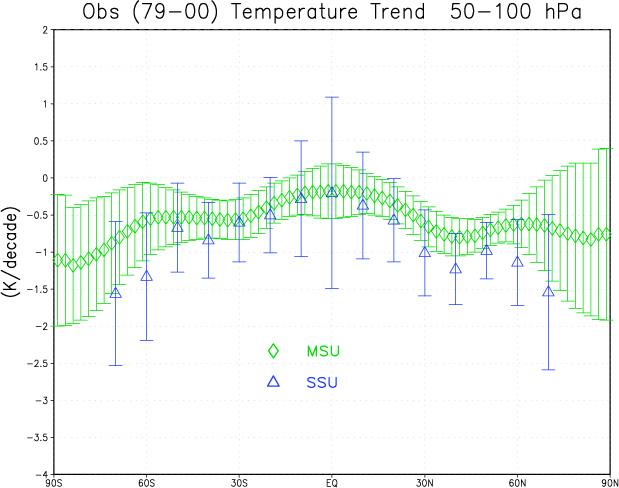
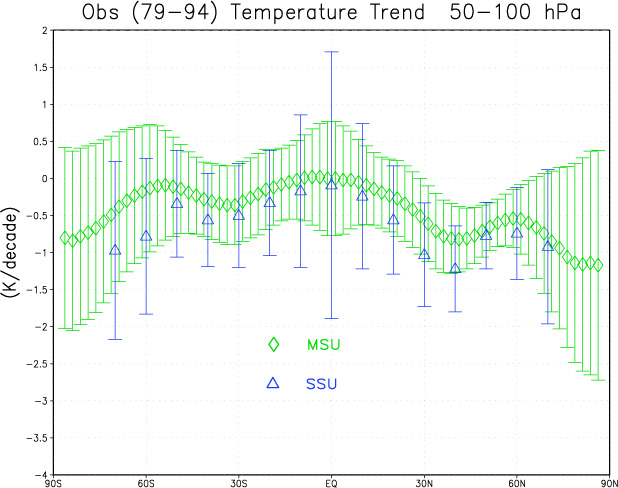
Figure 1 (top panel) illustrates the 1979-2000 trends in the zonal, annual-mean lower
stratosphere temperatures, as obtained from the MSU and SSU 15X satellite data sets. The bottom panel shows the 1979-1994 estimates
from the same two satellite data sets (see also Plate 1 in Ramaswamy et al., 2001). Also plotted are the 2-sigma level
uncertainties in the trends for each time period. Considering each satellite data separately, the trend estimates in any latitude belt do not
change appreciably, to within statistical uncertainty, in going to the longer time period. For both satellite data, differences in the mean
trend values between the two time periods tend to be larger at the higher latitudes; for MSU, such differences are considerably smaller
than for SSU. The SSU mean trend estimates are more negative for the longer period, especially in the mid-to-high latitudes in both
hemispheres. For MSU, there is a slightly lesser cooling trend in the high northern al-titudes for the longer time period, with the
difference not being significant. For the 1979-2000 period, the SSU mean values are considerably colder than the MSU in the high
latitudes of both hemispheres. Differences between MSU and SSU may be partially attributable to the different height regimes from
where the signals are received for the two sensors (see Ramaswamy et al., 2001). The peak in the SSU 15X signal emanates from
a higher altitude than in the case of MSU. The slightly shorter record of the MSU could also be a contributing factor. The large variance
seen at the equator, especially for the SSU, is likely due to the fact that QBO variance, an intrinsic fea-ture of the climate system,
has not been explicitly factored in the trends determination. Overall, the uncertainty estimates for the MSU and SSU are such that
a consistency can be said to exist in their respective trends, over each latitude belt, in both hemispheres, and for each time period
considered, irrespective of whether the trend at any latitude is statistically significant or not. Considering that the MSU is a
microwave-sensing instrument and SSU an infrared one, it is noteworthy that both satellites indicate approximately similar trends,
within the realm of statistical uncertainty. Of par-ticular note is the fact that, over both periods, the two satellite data sets indicate
a statistically sig-nificant trend to be present in the mid-latitude (~30-60°N) Northern Hemisphere (NH) (see also Ramaswamy
et al., 2001 for the 1979-1994 trends discussions). It is somewhat encouraging that this continues to be a robust feature for the
longer time period considered. It is further interesting that, in contrast to the shorter period, the 1979-2000 trends more clearly
indicate the presence of statistically significant cooling trend in the Southern Hemisphere (SH) poleward of 20 degrees. For both data,
MSU in particular, the uncertainty estimates are less for the longer time period.
 |
|
Fig. 1a
(please contact the SPARC Office, for a better resolution of the image) |
 |
|
Fig. 1b
(please contact the SPARC Office, for a better resolution of the image) |
| Figure 1. Zonal, annual-mean temperature trends (K/ decade) in the ~50-100 hPa region, as derived from the MSU and SSU 15X satellite observations. Top panel is trends for the 1979-2000 (the SSU data extends only through 1998) period while the bottom panel is for the 1979-1994 period. Also shown in both panels are the corresponding 2-sigma level uncertainties. [Courtesy: MSU data (J. Christy); SSU data (J. Nash); assembled by SPARC-STTA]. |
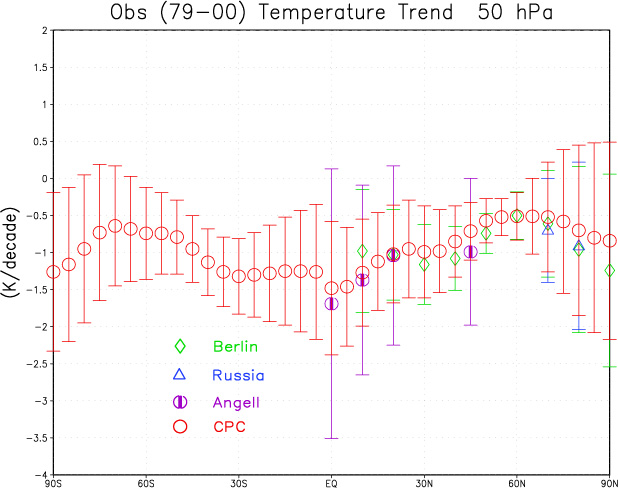
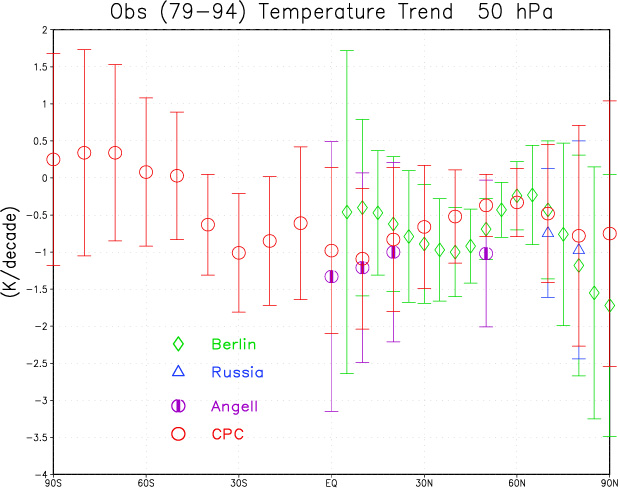
Figure 2 illustrates the zonal, annual-mean trends, and the 2-sigma uncertainty for the 50 hPa level, as obtained from the non-satellite data sets. As with the satellite data ( Figure 1), in an overall sense, almost all latitude belts in the zonally averaged sense have a mean trend that is generally one of cooling. Considering the entire 1979-2000 period, the zonal pattern of the mean trend values in Figure 2 is seen to be generally consistent with the pattern for the satellite data sets in Figure 1, with a relatively larger cooling in the high southern and northern latitudes, a statistically significant cooling in the mid-latitudes, and a cooling trend that is accompanied by a larger uncertainty in the equatorial and high latitudes. In the SH, from the CPC analyses, the longer period exhibits an increased cooling trend than over the earlier period; however, the 2-sigma estimates re-main large enough to suggest that it is difficult to discern a statistically significant change between the two time periods, as in the case of the satellite trends. At the equator, the sonde data sets do not indicate statistically significant results for either time period although there is hint of a lesser am-biguity for the longer time period. The large variation at the equator is, especially for Berlin over the 1979-1994 period, as in the case of the satellite data sets, likely due to not accounting for QBO in the trend estimation analyses. Between ~15-30°N, the data sets suggest more of a tendency for a statistically significant cooling trend than over the shorter period. The Angell mean trends are slightly colder than Berlin in the low latitudes for the 1979-1994 period, but the agreement between them is considerably better for the longer period. In the northern mid-latitude (30-60°N), all the data sets tend to yield a statistically significant cooling over both time periods. For each data set, both the mean trend and 2-sigma estimates computed for the northern mid-latitudes using the addi-tional years are remarkably consistent with the earlier determination for the 1979-1994 period. Coherency amongst the data sets regarding this feature is excellent for the longer period, too, just as was noted for the 1979-1994 period (Ramaswamy et al., 2001). Added to the similar information content for these latitudes emerging from the satellite data (Figure 1), there is a robustness to the idea of an unambiguous cooling of the mid-latitude northern stratosphere over the past two decades. It is to be noted that the CPC data suggests a statistically significant cooling over almost all the SH belts for the longer period, consistent with the satellite data (Figure 1). Pole-ward of 60°N, the statistical significance is somewhat degraded in all the data sets for both time pe-riods, primarily due to the increase in the dynamical variability. For each data set, there is a suggestion of lesser uncertainty for the longer time period in the high latitudes (see also Figure 1). There is an extremely good consistency between the Berlin, Russia and CPC data sets at 70 and 80°N for both periods. Near the pole, all data sets yield a large uncertainty yet they are mutually consis-tent in indicating a larger cooling there than at 60°N. The trend values in the high northern latitudes are not distinguishable in a statistical sense between the two time periods, consistent with the SSU and MSU results (Figure 1). From the sonde data, a statistically significant cooling becomes more discernible for almost all latitude belts (an important exception is the high northern latitudes) over the longer period, consistent with the feature seen in Figure 1 for the satellite data. The good agree-ment between the data sets strongly confirms the notion of an unambiguous cooling of the global lower stratosphere over the last two decades, with the area of statistically significant cooling being more extensive than just the northern mid-latitude regions as was noted for the 1979-1994 period (WMO, 1999).
 |
|
Fig.2a
(please contact the SPARC Office, for a better resolution of the image) |
 |
|
Fig.2b
(please contact the SPARC Office, for a better resolution of the image) |
| Figure 2. Same as Figure 1, except for non-satellite data. The radiosonde data sets consist of Angell, Berlin and Russia, while CPC comprises an analyses data set. [Courtesy: Berlin data (K. Labitzke and B. Naujokat); Angell data (J. Angell); Russia data (Y. Koshelkov); CPC data (NOAA/ NCEP/ CPC); assembled by SPARC-STTA]. |
Figure 3 illustrates the annual-mean vertical profile of the trends in the NH averaged stratosphere (100 to 1 hPa) over the 1979-1994 period from sonde (Berlin and UKRAOB) and satellite (MSU and Nash SSU) data sets. The satellite values (MSU and SSU) have been plotted at the altitude of the peak emission altitude whereas, in actuality, the estimates represent the trend over a broad altitude layer (see Ramaswamy et al., 2001). In the lower stratosphere (30-100 hPa), the various data sets exhibit consistency in terms of both the mean trends and the 2-sigma values. Thus, throughout the lower stratosphere, not only can it be asserted that a statistically significant cooling has occurred, but that this is consistent for the different instrumental data. The mean cool-ing trend estimates in the 100-50 hPa and 30 hPa region are ~0.30-0.75 K/decade and 0.9 K/decade, respectively. The presence of a statistically significant trend, however, should be distinguished from the fact that there is a non-negligible spread in the estimate from any data set at any of the lower stratospheric altitudes, with the uncertainty being at least ~0.5 K. This hints at a limit to the accuracy with which the stratospheric decadal-scale changes can be pinned down cur-rently using the 95% level confidence estimates. Above 30 hPa, the only values that are available globally are the Nash SSU trends. The vertical trend profile confirms the general picture expressed earlier for northern mid-latitude (45°N) (Ramaswamy et al., 2001) viz., there is a decrease in the cooling trend occurring in the middle stratosphere, with a minimum (~0.25 K/decade) occurring at ~5 hPa. Above this altitude, there is an increasing cooling trend with altitude through to the stratopause (~1.2 K/decade at 2 hPa). The NH annually-averaged cooling is statistically significant from 100 to 1 hPa. It is unfortunate that there is a critical lack of other data sets that can provide corroborative information on the global trends in the middle and upper strato-sphere, a limitation that constrains slightly the robustness of the currently-derived trend values in the upper stratosphere, especially when contrasted with the situation for the lower stratosphere.
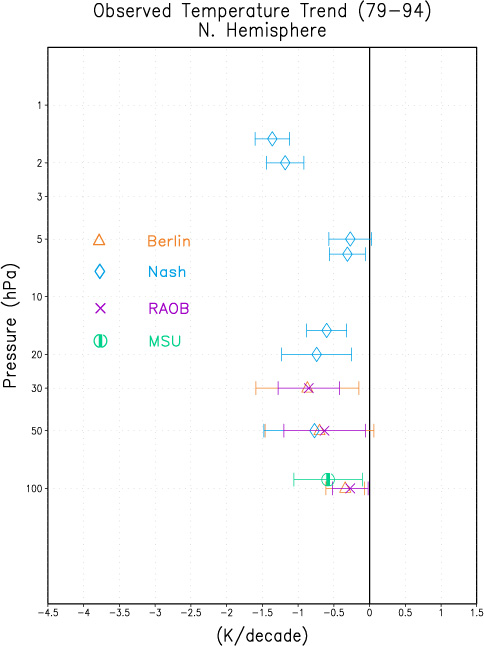 |
| Figure 3. Vertical profile of the annual-mean Northern Hemisphere trends from
various satellite and radiosonde data sets for the 1979-1994 period. Note that the Nash (same as “SSU”) and MSU
data, as plotted here, denote the peak altitude of emission whereas the emission comes from a broad range of altitude
surrounding the peak emission layer. [Courtesy: UKRAOB data (D. Parker); assembled by SPARC-STTA]. |
|
(Please contact the SPARC Office, for a better resolution of the image)
|
The NH annual-mean lower stratospheric (30-100 hPa) temperature trends (1979-1994) are statistically significant and exhibit a remarkable degree of consistency in terms of the trends and the 2-sigma estimates amongst the different radiosonde and satellite data sets. In the middle and upper stratosphere, there is only one data set that is available to estimate hemispheric trends. Nonetheless, the NH stratosphere, in an annually averaged sense, displays a statistically significant cooling from the lower through to the upper stratosphere. The shape of the trend in the vertical profile of temperature decrease is an important and distinct aspect of climate change over the past two decades. It ranks as a major, statistically significant change discerned in the climate variables for the 1979-2000 time period. Notwithstanding this determination of an un-ambiguous cooling, it is important to bear in mind the uncertainty in the trend estimates when pur-suing the attribution issue. For the zonally-averaged lower stratosphere, the annual-mean radiosonde trends over the 1979-2000 period indicate a statistically significant cooling over almost all the mid-to-high latitude in the two hemispheres, with the satellite data, too, hinting at this fea-ture over all areas except the high northern latitudes. This inference is an important update to the conclusion in WMO (1999) and Ramaswamy et al. (2001) with regards to the 1979-1994 trends, when the statistical significance of the cooling in the 50-100 hPa region was confined to only the northern mid-latitudes. There are suggestions that a longer period of evaluation yields the tendency for a statistically significant cooling even at low latitudes. A realistic assessment of southern lati-tudes is somewhat hampered by the lack of availability of an adequate number of data sets, in con-trast to the case for the NH.
With the observation-derived trends on the hemispheric and zonal, annual-mean time scales on a firm footing, there is a challenge to explain the causes of the observed temperature variations and changes on these space-and-time scales. In particular, it is important to address the question of the relative roles of well-mixed greenhouse gases, ozone, water vapour and aerosol variations/changes upon the evolution of the stratospheric temperatures, in part to assess the overall part played by ex-ternally applied radiative forcings in affecting stratospheric climate. In this regard, careful formu-lation and analyses of model simulations are needed, which, when compared with the observations, can provide a resolution of the attribution issues, and quantify the parts played by natural and anthropogenic factors. The models that are being deployed to address these challenges include general circulation models (GCMs) in which the trace species changes are prescribed, to coupled chemistry-climate models where the evolution of species is prognosed in some manner. While the roles of trace gases have been studied extensively and have likely been identified successfully as being the principal cause of the global-mean decadal-scale trends in the ~50-100 hPa region (WMO, 1995 and 1999), the precise roles of all trace species in explaining the vertical profile of the changes in the entire stratosphere has yet to be made definitive. Eventually, the modelling exer-cises will need to advance further and explain the cause/s of temperature evolution on spatial scales that are finer than zonal, and on time scales that are finer than annual.
Ramaswamy, V., M.-L. Chanin, J. Angell, J. Barnett, D. Gaffen, M. Gelman, P. Keckhut, Y. Koshelkov, K. Labitzke, J.-J. R. Lin,
A. O’Neill, J. Nash, W. Randel, R. Rood, K. Shine, M. Shiotani, and R. Swinbank, Stratospheric temperature trends:
observations and model simulations. Reviews of Geophysics, 39(1), 71-122, 2001.
WMO Scientific Assessment of Ozone Depletion: 1994, World Meteorological Organization Glo-bal Ozone Research and
Monitoring Project Report N°. 37, Chapter 8, Geneva, 1995.
WMO Scientific Assessment of Ozone Depletion: 1998, World Meteorological Organization Glo-bal Ozone Research
and Monitoring Project Report N°. 44, Geneva, 1999.
![]()