 |
Stratospheric Processes And their Role in Climate
|
||||||||
| Home | Initiatives | Organisation | Publications | Meetings | Acronyms and Abbreviations | Useful Links |
![]()
|
Stratospheric Processes And their Role in Climate
|
||||||||
| Home | Initiatives | Organisation | Publications | Meetings | Acronyms and Abbreviations | Useful Links |
![]()
A. R. Ravishankara, NOAA, Boulder, USA (ravi@al. noaa. gov)
Martyn Chipperfield, The Environment Centre, Leeds, UK (martyn@env.leeds.ac.uk)
Victor Fomichev, Toronto, Canada
Darryn Waugh, John Hopkins University, Baltimore, (waugh@curie.eps.jhu.edu)
A six-day symposium on Middle Atmosphere Chemistry and Transport was organised under the banner of ICMA. The conveners were A. R. Ravishankara (Boulder, USA), Martyn Chipperfield (Leeds, UK), Victor Fomichev (Toronto, Canada) and Darryn Waugh (Baltimore, USA). It was organised to cover the following themes:
1. Ozone trends in the stratosphere and the upper troposphere
2. Stratospheric and tropospheric processes
3. Stratospheric-Troposphere interactions
4. Mesosphere/upper stratosphere processes (2 sessions)
5. Stratospheric polar processes (2 sessions)
6. Measurements of atmospheric constituents
7. Laboratory studies of atmospheric processes
Each of the nine sessions, had two invited speakers. A total of 18 invited talks and 40 contributed talks were presented. Overall the discussions following the talks were lively. In addition, a poster session was also included and it had 11 posters. To give a flavour of the meeting, we have included brief summaries of the invited talks and some of the contributed talks.
The symposium started with a session on trends in ozone in the stratosphere and the upper troposphere (UT). Currently, this is a topic
of major interest. R. Hudson presented an analysis of satellite derived stratospheric column
ozone abundance from 1979 to 1992. He had averaged the data according to different 'dynamical' regimes from the mid-high latitudes based
on meteorological features of the troposphere and lower stratosphere (LS). Interestingly, when analysed in these regimes, the observed
downward trend in mid-latitude ozone mostly disappeared, suggesting, rather contentiously, that these trends are not related to chemical
loss but to the movement of dynamical regimes. J. Logan presented an analysis of ozone sonde
data for the UT/LS for stations over Europe and Canada. The observations near 18 km showed a clear downward trend. However, in the
lowermost stratosphere, a difficult region to analyse, the variability was much larger with less indication of an overall trend. These
ozone trends and their analyses will be a major component of the upcoming WMO/UNEP ozone assessment.
Other presentations discussed the effects of dynamics and chemistry on the trends in column ozone and the effects of ozone changes
on the stratosphere.
M. Mlynczak presented a detailed estimate of how well we can observe the atmospheric energy budget from the edge of space down to the surface. He stated that with a forthcoming TIMED satellite observations we will be able for the first time to directly observe or derive from appropriate measurements the rates of solar heating and infrared cooling throughout the entire atmosphere below 100 km. This was augmented by contributed talks on the energy budget produced by the extended Canadian Middle Atmosphere Model from the tropopause up to the lower thermosphere and latitude-altitude distribution of the infrared cooling calculated with use of temperature, atomic oxygen and CO2 data retrieved from the CRISTA limb radiance measurements.
V. Ogibalov presented an overview of the current state of the non-LTE problem for the vibrational rotational CO2 bands and discussed features and accuracy of recently developed non-LTE models.
Papers presented by M. Kaufmann and S. Melo
dealt with measurements of temperature structure and composition of the mesosphere and lower thermosphere region. Kaufmann presented
results on temperature, O3 and CO2 obtained during two CRISTA missions. The CO2 mixing ratio
in the 70-100 km region is significantly smaller than that shown by previous rocket borne mass spectrometer data and shows considerable
latitudinal variation. Temperature and CO2 profiles retrieved from the first CRISTA mission were also presented during
contributed talks and shown to be in good agreement with those presented by Kaufmann. In addition, a new algorithm for the retrieval of
kinetic temperature from measurement of CO2 limb emission was also presented.
Other talks addressed the role of precipitating electrons and solar proton events in affecting O3 abundance in the upper
stratosphere and mesosphere and the impact of time dependent O3 and Sea Surface Temperature in numerical simulation
of the middle atmosphere.
T. Peter presented lidar measurements made during the APE-THESEO aircraft campaign
based out of Mahé/Seychelles (5S) in February/March 1999. They show ultra-thin subvisible clouds near the tropical tropopause.
It was argued that large upwelling (around 5mm/s) covering a broad region is required to explain the existence and stability of these
clouds. Some evidence for large upwelling in ECMWF analyses was also presented. C. M. Volk
also presenting measurements from the APE-THESEO campaign, focused on in situ tracer measurements (N2O, CFCs, SF6,
and O3) made just above and below the tropopause. The vertical profiles of the tracers show almost constant values in the
UT (340-380K), indicating little mixing of stratospheric air into this region. Assuming no mixing and specified production rates,
upwelling of around 2mm/s was inferred from the measured ozone profiles. Latitudinal gradients in the tracers were also examined,
and tracers with large inter-hemispheric surface gradients (e. g. , SF6) were shown to still have significant gradients in the upper
troposphere.
Other presentations discussed the observations of water vapour in the tropical UT, tracer correlations near high latitude UT, and
models of chemistry-climate feedbacks. There were also talks on cross tropopause exchanges of species and the impact of solar cycle
on stratospheric circulation.
The measurements of atmospheric species, a key part of atmospheric research, included invited talks by
J. Burrows and P. Wennberg.
Burrows demonstrated the capacity of satellite-based instrument for providing much needed data on a global scale for many stable and
reactive species. He exemplified the capabilities by using the data from the GOME satellite
(Figure 1). It included data on stable species such ozone and nitrogen dioxide as well free
radicals such as BrO. The ability of the satellite to get information on tropospheric composition was a significant showing. Wennberg
concentrated on local measurements of free radicals such as OH and HO2, in conjunction with many other stable species
from the ER-2 aircraft. He demonstrated the power of such measurements in getting key information on atmospheric processes,
including the ability to constrain the uncertainties in reaction rate coefficients. He highlighted his talk by showing the importance to
overtone photodissociation of HO2NO2 as source of odd-hydrogen in the lower stratosphere
(Figure 2).
Satellite derived evidence for meridional mixing of minor constituents, use of DOAS in satellite measurements, algorithms for aerosol
retrieval, and in situ measurement of chlorine oxides in a rocket plume were also presented.
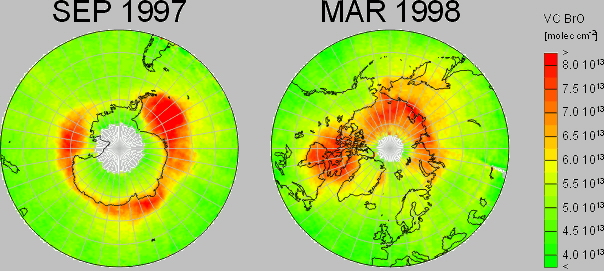 |
| Figure 1. The abundance of tropopsheric BrO measured from the GOME satellite. Such measurements of reactive species from space highlight the capability of satellite in providing valuable atmospheric data. |
|
(Please contact the SPARC Office, for a better resolution of the image)
|
|
|
| Figure 2. Wennberg showed that in the UT/LS the IR photodissociation
cross sections of HO2NO2 yields a photolysis rate of ~ 1 x 10⁻⁵ s-1,
independent of the solar zenith angle. In much of the lower atmosphere, this process is often the dominant photochemical loss
mechanism for HO2NO2. Photochemical models that ignore this process, overestimate the
concentration of HO2NO2 and thereby overestimate the loss rate of OH via
OH + HO2NO2. The figure shows the measured photodissociation cross sections for
HO2NO2 in the near IR. Photodissociation in this spectral region is dominated by excitation of the
overtone of the OH stretching frequency near 7000 cm-1. The quantum yield for photodissociation is less than
unity because the energy of these photons is less than the 0 K bond dissociation energy, Do. |
|
(Please contact the SPARC Office, for a better resolution of the image)
|
The heart of middle atmospheric chemistry is the processes that control the ozone level and the radiation balance in this region. Therefore, two invited talks and many contributed talks addressed these issues. S. Lal presented vertical distributions of several trace gases (e. g., N2O, CH4, CFCs, and SF6) from balloon flights from Hyderabad, India (17. 5°N, 78. 6°E) made between 1985 and 1998. Several important quantities were calculated, including the age of the air (from SF6), the total amount of organic and inorganic chlorine, and the lifetime of several of the tracers (using known lifetimes of other tracer and tracer-tracer correlations). D. Hartmann presented calculations from a radiative transfer model that show that thin cirrus near the tropical troposphere are radiatively cooled if they lie above thick convective anvil clouds. Hartmann argued that this cooling leads to subsidence and low tropopause temperatures, and that quasi-horizontal advection through these cold regions could be an efficient mechanism for dehydration of stratospheric air. Other talks addressed the recovery of chlorine as seen from satellite data, the variability of stratospheric sulphate abundance, and variation of nitrogen oxide concentrations. Some talks addressed the variability of the stratosphere as seen in GCM simulations, tracer-tracer correlation, age of air, distribution of BrO and its impact on ozone, and the simulation of Mt. Pinatubo aerosol.
Stratospheric Polar ProcessesThe current heightened interest in the Arctic ozone changes in the stratosphere led to a session with four invited
talks and many contributed talks. First, D. Fahey presented measurements
from the ER2 aircraft made during the SOLVE/THESEO campaign in 1999/2000, which show extensive denitrification,
chlorine activation, and chemical ozone loss within the Arctic vortex. These measurements also indicate large
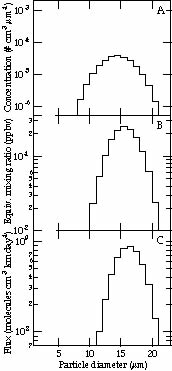
HNO3-containing particles ("rocks"), up to 20 micron in diameter (Figure 3),
which provide an effective mechanism to denitrify the LS. Fahey also presented an analysis of ozone and NOy loss that showed
an enhancement of chemical ozone loss in denitrified air parcels. P. Newman presented
the results from an analysis of LS polar temperatures and eddy heat fluxes using NCEP/NCAR reanalyses. This analysis showed
that the spring polar temperatures are controlled by the integrated wave activity over the preceding 45-60 days, and that the
recent cold northern winters are a result of this weakened wave driving of the stratosphere. Output from several GCMs was
also analysed, and model-data biases were noted. There were a total of 11 presentations (including 4 invited and 1 poster)
dealing with processes in the upper stratosphere-lower mesosphere region. M. Rex
presented results from the MATCH technique for diagnosing Arctic ozone loss for the past 10 years. The derived loss
correlates with the availability of sunlight as expected. The loss also shows an extremely tight, almost linear, correlation
with the area available for PSC formation - a tighter correlation than might be expected when considering other atmospheric
variability. The last invited talk in this session was by F. Goutail. She also discussed
Arctic O3 loss based on comparisons of ground-based and satellite data with models. She showed that under certain
conditions the models could reproduce the observed loss well, while in other winters the models have a tendency to underestimate
the loss. |
 |
|
| (Please contact the SPARC Office, for a better resolution of the image) |
Fig.3
|
|
| Figure 3. Results from the large PSC particle observations made by the
NOy instrument on board the NASA ER-2 aircraft. The NOy dataset used in the analysis is an
800-s interval obtained at 19. 5 km near the North Pole on January 20, 2000. A statistical simulation of the
NOy time series values was used to determine the sizes of large (> 5 µm diameter) NAT particles
sampled by the instrument. The panels show (A) the best-fit size distribution and number concentration, (B) the equivalent
gas-phase mixing ratio of HNO3 derived from the distribution, and (C) the derived sedimentation flux of
HNO3. The concentration integral of the large mode is 2. 3 x 10⁻⁴ cm-3.
The lower limit of the vertical axis in (A) corresponds to the detection of a single particle over the 800-s observation period.
The total gas-phase HNO3 in the large mode is 1. 5 ppbv. The HNO3 flux of the combined
distribution is 5 x 10⁹ molecules cm-3 km day-1 or 2.2 ppbv km day-1 at 60 hPa.
Significant denitrification would result if this flux were maintained in the lower stratosphere for a period of a few days or
more. Adapted from Fahey et al. Science 2001, 291, 1026-1031). |
||
In the session dealing with laboratory studies, which form the underpinning of our understanding of the atmosphere, there were two
invited talks; the first dealt with gas phase chemical kinetics and second with heterogeneous reactions. P. Wine
updated the current understanding of the rate coefficients for reactions of nitrogen species in the stratosphere. It ranged from the
reactions of O(1D) with HCN and CH3CN to the reaction of O atoms with NO2. The talk highlighted how certain
key stratospheric reactions have been defined to very high accuracy such that the uncertainties associated with the rate coefficients of
such reactions are negligible in defining stratospheric ozone depletion. J. Abbatt exemplified
the basic steps involved in the heterogeneous reactions on ice. The talk showed how surface uptake/reactions may be enhanced two
reactants that react together are simultaneously exposed to ice surface. The reaction that was highlighted involved sulphur dioxide and
hydrogen peroxide, which play major role in the formation of sulphate from SO2 in the troposphere.
These talks were followed by description of kinetics studies on OClO, balloon borne measurements of PSCs, and modelling the effect of
short-lived halocarbons on stratospheric ozone.
L. L. Hood, University of Arizona, Tucson, Arizona, USA (lon@lpl.arizona.edu)
The workshop was convened to investigate the importance of solar UV variability and energetic particles in modifying stratospheric
and/or tropospheric circulation on the time scale of the 11-year solar cycle. A series of invited reviews was interspersed with
shorter contributed talks. Ample time for discussion was provided.
In a review talk K. Labitzke summarised the statistically derived structure of the solar
cycle response in the lower stratosphere (LS) and troposphere, based on data encompassing four solar cycles. Differences of geopotential
heights and temperatures between solar minimum and maximum were estimated in the LS using both reanalysed NCEP data and analyses
performed at the FUB, Berlin. It was pointed out that the global solar signal in January and February is modulated by the equatorial wind
QBO. J. Staehelin emphasised the importance of including the QBO and NAO as dependent variables
in regression analyses which attempt to estimate solar cycle responses in the LS. Using the Arosa total ozone series (1926 to present),
it was shown that an apparent solar cycle correlation disappears when both the QBO and the NAO are included in the regression model.
Using the Payerne ozone profile series, it was also shown that the influence of the solar cycle at this location is largest in the summer
season at 26 to 30 km. L. Hood reviewed satellite data analyses indicating a significant
response of ozone and temperature to solar cycle forcing in both the upper stratosphere (US) and the LS. From SBUV data, the ozone
variation in the US from solar minimum to maximum was estimated by multiple regression analysis and found to be more than 3% while
that in the middle stratosphere was nearly zero. This apparent direct photochemically induced ozone response in the US is accompanied
by a temperature response, with a maximum of about 0.9 K near 3 hPa (from SSU data). In the tropical LS (40 to 120 hPa), the
MSU ch. 4 data indicate a solar cycle component of temperature variability of 0.70 +/- 0.20 K. Based on a combined satellite total ozone
data record covering 2 solar cycles, the solar cycle component of tropical total ozone variability has an amplitude of several per cent.
Most of the column ozone variation occurs in the LS. M. Salby reviewed statistical evidence
that the equatorial wind QBO may itself vary slightly with the solar cycle. For example, based on a 40-year record, it appears that the
QBO westerly phase at levels below 30 hPa tends to be longer in duration under solar minimum conditions than under solar maximum.
These changes in westerly wind duration introduce a drift into the QBO phase in winter months, when the polar vortex is sensitive to
equatorial wind direction. It was therefore suggested that this apparent solar modulation of the QBO may explain the large observed
solar cycle variation of polar LS temperatures when data are separated according to QBO phase.
In one of a series of talks on GCM studies, J. Haigh discussed recent simulations of the
effect of realistic solar spectral irradiance changes on the stratosphere and troposphere. Using two different GCM's, a reproducible
mode of response was found in zonal mean temperature and wind fields, especially at low latitudes and in the summer hemisphere.
Results were shown to be sensitive to whether solar-induced ozone changes in the stratosphere were included in the model. K. Weber
emphasised that present GCM simulations tend to underestimate the amplitudes of observed changes or even yield contrary results.
In part, these differences are due to differences in the formulation of parameterisations, such as those which determine solar-induced
changes in ozone concentration. Using the University of Illinois GCM with interactive photochemistry,
E. Rozanov obtained an ozone mixing ratio increase of up to 3.5% and a 0.5-1 K
warming from solar minimum to maximum in the tropical US. A weak acceleration of the stratospheric polar night jets was also
detectable. Propagation of the solar signal downward and northward during the boreal winter resulted in an intensification of the
polar vortex during the late winter and early spring. The pattern of model estimated surface air temperature changes in December
was similar to that observed after volcanic aerosol injections. K. Kodera suggested that
an understanding of the diversity of dynamical responses to solar cycle forcing obtained in different models requires a
consideration of the balance between solar radiative forcing and dynamical forcing due to planetary waves. In particular,
differences in model parameterisations may have the largest impact in early winter during the transition period from a
radiatively controlled state to a dynamically controlled state. It is during this period when solar radiative forcing can have
the greatest impact, thereby perturbing the winter stratosphere into one of its preferred internal modes, e.g., the positive
mode of the Arctic Oscillation.
D. Siskind first discussed long-term variations in upper atmospheric nitric oxide and coupling to the middle atmosphere. It has only recently become apparent that this variability maps down into the stratosphere at polar latitudes during winter. Associated with these NOx enhancements near solar maximum is a reduction of springtime polar ozone by up to 40% between 10 and 20 hPa. Transport of odd nitrogen to lower latitudes in the stratosphere is more controversial. However, L. Callis presented model simulations suggesting that non-auroral energetic electrons can contribute significantly to the odd nitrogen budget of the mid to high latitude stratosphere, thereby also affecting the solar cycle variation of ozone. He argued that this neglected contribution from energetic electron precipitation can potentially account for existing differences between observational estimates of the solar cycle ozone variation and model estimates based on solar UV variations alone. A. Krivolutsky conducted statistical analyses of total ozone and Galactic Cosmic Ray (GCR) fluxes at several high-latitude Russian stations. In contrast to theoretical expectations based on odd nitrogen chemistry, it was found that total ozone tends to increase during years of increased GCR fluxes. B. Tinsley presented a brief overview of his model for explaining possible correlations of global cloud cover and winter storm tracks with solar activity variations. The model hypothesises that solar cycle changes in GCR flux can modify the global electric circuit with indirect effects on the formation of cloud condensation nuclei (CCN). In an invited review, J. E. Kristjansson questioned the robustness of previously reported correlations between decadal changes in GCR flux and global cloud cover. Using alternate satellite cloud cover data, he found that the earlier correlation does not continue after 1988. He then discussed the theoretical issue of whether cosmic ray ionisation can create CCN in nature. M. Todd reported on a statistical investigation of the relationship between cloud cover and short-term (Forbush) decreases of GCR's. Analysis of data averaged in geomagnetic latitude bands yielded significant correlations mainly at high latitudes. The cloud/GCR correlations were found primarily using high-level cloud data (10-15 km) and were especially pronounced over Antarctica. Analysis of Forbush decrease events associated with solar proton burst events showed no statistically significant cloud anomalies.
Current research focuses primarily on the hypothesis that direct effects of solar UV variability in the US, especially under
near-solstice conditions in early winter, can affect the selection of preferred internal modes in the northern winter stratosphere.
Like volcanic forcing, solar forcing tends to favour the positive mode of the northern annular mode (or Arctic Oscillation) in the late
winter LS, a mode that has been found observationally to be connected with tropospheric circulation anomalies. However, existing GCMs
do not yet accurately simulate the magnitude or, in some cases, even the sense of the LS responses derived from observations. Of special
interest in the area of energetic particle precipitation is the evidence summarised above for short-term cloud anomalies at high
geomagnetic latitudes and altitudes associated with GCR Forbush decreases. Such evidence, if verified by later studies, would add
credence to the concept that GCR fluxes can affect the production of cloud condensation nuclei. However, statistical evidence for GCR
effects on cloud cover at lower latitudes and altitudes on any time scale must be categorised at present as inconclusive.
![]()