 |
Stratospheric Processes And their Role in Climate
|
||||||||
| Home | Initiatives | Organisation | Publications | Meetings | Acronyms and Abbreviations | Useful Links |
![]()
|
Stratospheric Processes And their Role in Climate
|
||||||||
| Home | Initiatives | Organisation | Publications | Meetings | Acronyms and Abbreviations | Useful Links |
![]()
The major areas of research and operational activity in atmospheric science are concentrated in two government organisations: the Bureau of Meteorology and CSIRO Atmospheric Research, both based in Melbourne. However, these two organisations have relatively little involvement in stratospheric research, and the activities related to SPARC are spread over a number of small groups in different organisations. From 1993, the Co-operative Research Centre (CRC) for Southern Hemisphere (S.H.) Meteorology, based at Monash University in Melbourne, provided a focus for stratospheric research in Australia and it hosted the first SPARC General Assembly in 1996. However, funding for this Centre ceased and it closed in June 2000.
Ozone monitoring. Art Downey, Bureau of Meteorology (BM), Victoria
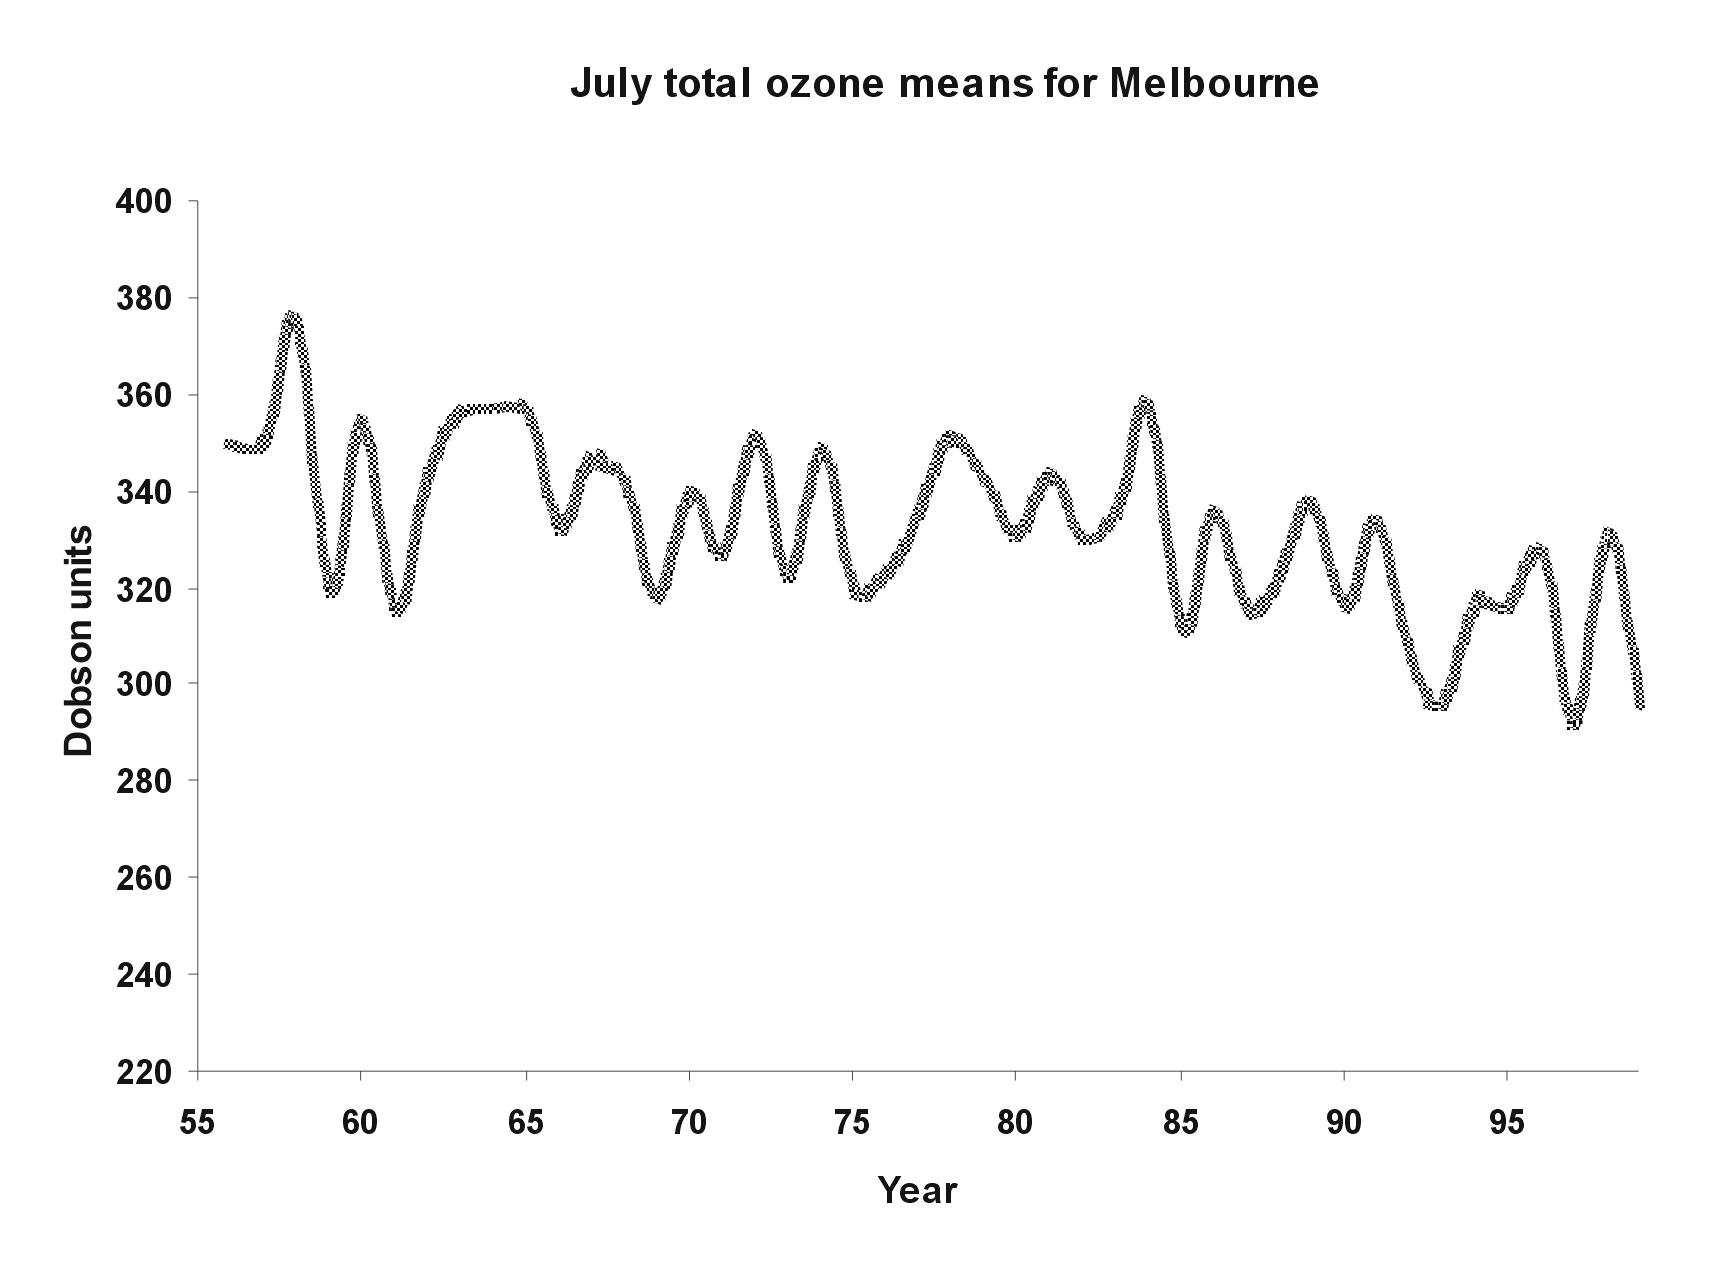
Dobson spectrophotometers are used to estimate total column ozone at five stations (Melbourne, Perth, Brisbane,
Macquarie Island, and Darwin). Figure 1 shows column ozone time series from Melbourne. At non-ozonesonde
stations, the Dobson spectrophotometers are also used to perform Umkehr observations, to estimate the vertical profile
of ozone in the stratosphere. Regular weekly ozonesonde flights are carried out at Melbourne. In addition, a research
ozonesonde program, of one flight per week, was established at Macquarie Island at the end of 1996; the BM plans to
continue to operate this important station while funding is available.
The data are sent to the WMO World Ozone and UV Data Centre in Toronto, Canada, for archival and international
perusal 3 to 4 months after collection. For Macquarie Island, the data cycle is somewhat extended because of logistic
problems due to the remoteness of the site.
 |
|||
|
Figure 1. July mean total column ozone at Melbourne from Dobson observations for 1955-99. |
|||
Ground-based remote sensing of trace gases by solar spectroscopy.
David Griffith, University of Wollongong, NSW. http://www.uow.edu.au/science/research/acrg/.
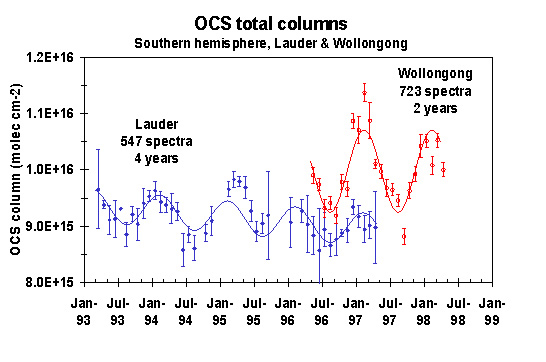
A complementary site in the Network for Detection of Stratospheric Change (NDSC) using ground-based FTIR solar spectroscopy has operated at the University of Wollongong, NSW since 1996. High-resolution solar FTIR measurements are made automatically on all days when weather permits, and the spectra are analysed for total vertical columns and partially resolved vertical profiles of over 30 trace gases. The system is augmented with UV/Vis measurements made along the same optical path. Figure 2 illustrates typical measurements (Griffith et al., 1998).
 |
|||
|
Figure 2. Typical FTIR solar spectroscopy measurements showing a monthly mean time series of total
column OCS above Wollongong. |
|||
UV radiation monitoring.
Peter Gies, Australian Radiation Protection and Nuclear Safety Agency (ARPANSA), Victoria (Peter.Gies@health.gov.au)
The UV group in ARPANSA (formerly the Australian Radiation Laboratory) is slowly converting their measurement data-logger
sites to two unit systems, a Solar Light UV Biometer 501 (biologically-effective UVR) and Eppley TUVs (total UVR 290 to 400 nm).
The IL actinic and UVB detectors are being phased out as they are getting old. Currently, they are running sites at Melbourne, Sydney, Newcastle, Brisbane, Townsville, Cairns, Darwin, Alice Springs, Adelaide, Perth, Macquarie Island, and Mawson, Davis, and Casey in the Antarctic.
In addition, a weather-proof spectral system is running almost continuously in Melbourne. There are also some spectral
measurements being done at Davis. Several small portable spectral units are being built to do more regular calibrations at
sites other than Melbourne.
Proposed studies of the Antarctic Stratosphere using a high spectral resolution Lidar.
Andrew Klekociuk, Ray Morris, Australian Antarctic Division (AAD), Tasmania (andrew.klekociuk@aad.gov.au)
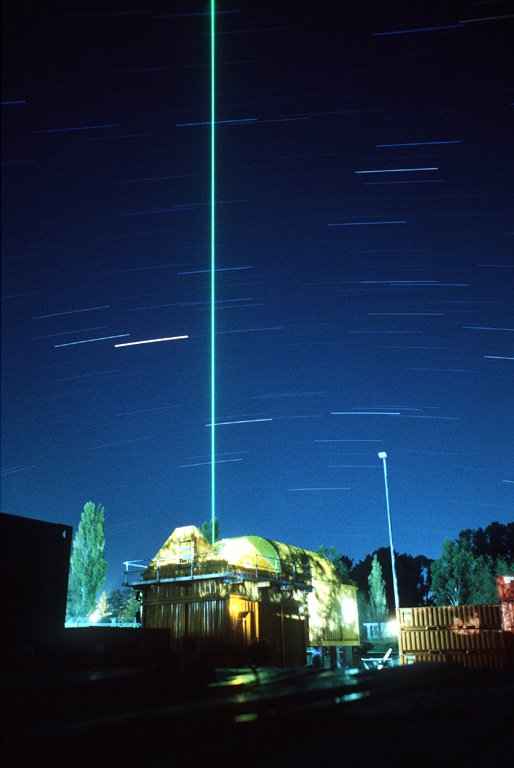
The AAD and the University of Adelaide have developed an atmospheric lidar for investigating climate change in the middle
atmosphere (Morris et al. (1995), Klekociuk et al. (1994). Figure 3 shows the lidar in operation at Kingston, Tasmania.
From 2001, the lidar will be located at Davis station to profile temperature, wind velocity and aerosol loading in the Antarctic
stratosphere and mesosphere over a full solar cycle.
The lidar altitude range is 10km to between about 65km and 90km during both day and night. The upper altitude limit depends on
the type of observation being conducted, the time of day, and the time resolution required. The maximum vertical resolution
will be about 20m. The basic data set will comprise profiles of molecular density, temperature, wind velocity and aerosol loading
as a function of altitude and time.
The instrument can be configured in either a monostatic arrangement which allows coaxial viewing to a maximum zenith angle
of 45°, or a higher power biaxial arrangement which is restricted to observing the zenith. The laser wavelength is 532 nm,
and the maximum power-aperture product of the system is 24Wm2
(see http://www.antdiv.gov.au/aad/sci/atmos/lidar/lidar.html).
At Davis, intensive Rayleigh lidar observations will be conducted using both coaxial and biaxial optical configurations. It is
also planned to fly radiosondes to altitudes of up to 35km, which when combined with the expected lower ceiling of the
stratospheric aerosol layer, should allow the density retrieval method to be calibrated with in-situ measurements. In addition,
temperature profiles will also be obtained from incoherent Doppler and Raman scatter measurements, which will provide for
important cross-comparisons potentially extending down through the aerosol layer.
 |
||||
| Figure 3. Lidar in operation at Australian Antarctic Division, Kingston, Tasmania. | ||||
Ozone-depleting chemicals.
Paul Fraser, CSIRO Atmos. Res., Victoria
In situ analyses of air at Cape Grim, in north-west Tasmania, and from the Cape Grim air archive, with sensitive
GC-ECD and GC-MS systems, are being used to investigate trends in the background atmosphere of ozone-depleting substances
(ODS) and their replacements.
The data show that the combined accumulation of ODS has peaked and is declining slowly, due largely to the rapid loss of methyl
chloroform from the atmosphere. The on-going decline of total ODS is threatened by the continuing growth of some CFCs
(chlorofluorocarbons) and halons, which are still being emitted from their large ëbanksí in the developed world
(old refrigeration and fire-fighting systems) and by their expanding use in the developing world. The rapid accumulation of CFC
replacements, such as the HCFCs (hydrochlorofluorocarbons) and HFCs (hydrofluorocarbons), in the background atmosphere is
in accord with expectations based on the phase-out of CFCs and other ODS as mandated by the Montreal Protocol.
Gravity waves and radar observations of the middle atmosphere. Robert Vincent, University of Adelaide, SA
(rvincent@physics.adelaide.edu.au)
Observational characteristics of GW in the stratosphere are being determined from high-resolution radiosonde data.
This study is being co-ordinated with the SPARC gravity wave initiative. Radar studies are being used to investigate the variability
of winds, GW and turbulence in the middle atmosphere.
UV radiation. Lilia Lemus-Deschamps, Lawrie Rikus, BM Research Centre, Victoria
In Australia, operational UV forecasts have been issued by the BM to the public since September 1996. The UV forecast system
was developed by the CRC for the S.H. Meteorology in collaboration with the BM (Lemus-Deschamps et al., 1998). The biologically
effective radiation dose is calculated from the product of the UV radiation incident at the surface and the erythemal action-spectrum
(CIE) integrated over wavelength and divided by 25 mW/m2 , giving a unitless number defined as the UV Index. The clear sky UV Index
is forecast daily for the next day at local solar noon. The forecast system is based on a two stream delta Eddington radiation model,
a deterministic total ozone scheme, and the meteorological fields from the global numerical weather forecast model of the BM (GASP).
Cloud effects have been included by using a very simple approach; the clear sky UV Index is multiplied by a cloud factor, which is
prescribed for different cloud conditions, and which has been determined from the relationship between the erythemal dose and cloud
cover.
In an attempt to derive cloudy UV Index forecasts for Australia from meteorological variables and the standard radiative transfer
formulation, two approaches have been investigated to derive cloud transmission factors from:
(i) an empirical algorithm between the observed UV Index (Australian Radiation Laboratory), the model clear sky UV Index and the
cloud cover (BM), and
(ii) including detailed interactive cloud optical properties in the UV radiation scheme.
Stratospheric circulation modelling.
Greg Roff, BM Research Centre, Victoria
A stratospheric version of the BM global spectral atmospheric circulation model (BAM) has been developed. This is being used as
part of GRIPS Task 1 to examine how well the various GRIPS models can capture the initiation, evolution and eventual decay of the
polar vortices in both hemispheres. To this end, elliptical diagnostics are being used to compare the simulated vortex 4D lifecycle
from several years of daily model and climatology data. Daily elliptical diagnostics are calculated on individual isentropic surfaces
by fitting an ellipse to the polar vortex, which is defined as the potential vorticity (PV) contour with the maximum latitudinal PV
gradient. The full model and climatology data sets are being processed at present.
Stratospheric Chemical Transport Modelling.
Ian Plumb, CSIRO Telecommunications and Industrial Physics, NSW
This group maintains a suite of atmospheric models, comprising a box model and 2D and 3D CTMs. The models share common
chemical solvers and radiative transfer routines. The transport component of the 3D CTM is based on the NCAR MATCH model.
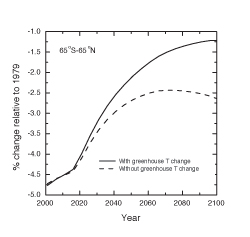
Current research activities include modelling long-term trends in ozone, with particular emphasis on the role of temperature changes
resulting from greenhouse gases (see Figure 4) and on increasing concentrations of N2O and CH4. These factors are
important in determining the evolution of stratospheric ozone and therefore the amount of UV radiation reaching the ground
(Plumb and Ryan (1998)), as halogen levels in the atmosphere decline. Recent laboratory measurements of key reactions
involving nitrogen species have resulted in increased calculated levels of active nitrogen in the middle stratosphere
(Randeniya et al. (1999)) and inclusion of these kinetic data in the model also has a major effect on calculated ozone trends.
 |
||||
| Figure 4. 2D CTM study of the impact of greenhouse-gas-induced temperature changes on the future recovery of global column ozone amounts. | ||||
In other studies, the role of transport variations in determining long-term ozone trends and the influence of polar processes on mid-latitude trends are being investigated. Polar processes are also being studied with the 3D CTM, using both GCM and analysed winds. The aim of this work is to simulate the interannual variations in Arctic and Antarctic ozone depletion. Comparison of the concentrations and correlation (Plumb et al. (1999)) of long-lived tracer fields generated using the 2D and 3D CTMs provides additional insight into the role of transport processes in the stratosphere. The impact of increases in air traffic, including both subsonic aircraft and proposed fleets of supersonic aircraft, is also being studied.
Interannual variability and trends in the Southern Hemisphere stratospheric circulation. David Karoly, Monash University,
Victoria
In collaboration with the stratospheric modelling groups at BMRC in Melbourne and CSIRO TIP in Sydney mentioned above,
a diagnostic and modelling study is being undertaken to investigate the causes of the interannual variations and long-term trends
in the S. H. stratospheric circulation and ozone. This project is an extension of research activities started in the CRC for
S. H. Meteorology.
Griffith, D. W. T., N. B. Jones and W.A. Matthews (1998) Interhemispheric ratio and annual cycle of carbonyl sulphide (OCS) total column from ground based solar FTIR spectra. J. Geophys. Res. 103, 8447-8454.
Klekociuk, A. R., P. S. Argall, R. J. Morris, P. Yates, A. Fleming, R. A. Vincent, I. M. Reid, P. A. Greet and D. J. Murphy (1994) The Australian Antarctic lidar facility. In Proceedings SPIE 2266 Optical Spectroscopic Techniques and Instrumentation for Atmospheric and Space Research, edited by J. Wang, and P.B. Hays, pp. 624-634, The International Society for Optical Engineering.
Lemus-Deschamps, L., L. Rikus, and P. Gies (1999) The operational Australian Ultraviolet index forecast 1997. Meteorol. Appl.,
6, 241-151.
Morris, R. J., D. P. Monselesan and A. R. Klekociuk (1995) Australian Antarctic middle and upper atmosphere physics -
a new direction. Advances in Space Research, 16, 151-162.
Plumb, I. C., and K. R. Ryan (1998) Effect of aircraft on ultraviolet radiation reaching the ground. J. Geophys. Res., 103,
31231-31239.
Randeniya, L. K., I. C. Plumb and K. R. Ryan (1999) NOy and Cly partitioning in the middle stratosphere: A box model
investigation using HALOE data. J. Geophys. Res., 104, 26667-26686.
![]()