 |
Stratospheric Processes And their Role in Climate
|
||||||||
| Home | Initiatives | Organisation | Publications | Meetings | Acronyms and Abbreviations | Useful Links |
![]()
|
Stratospheric Processes And their Role in Climate
|
||||||||
| Home | Initiatives | Organisation | Publications | Meetings | Acronyms and Abbreviations | Useful Links |
![]()
It is widely accepted that there are several processes that contribute to the exchange of air between the stratosphere
and the troposphere in the tropics, chief among them deep convection (a fast vertical process) and the stratospheric circulation
(a slow vertical process). Yet, there is still a troubling uncertainty regarding the balance of processes that regulate the motion
of air across the tropical tropopause. This issue is highlighted in the recent SPARC Water Vapour Assessment (SPARC 2000).
There has been a reported increase in stratospheric water vapour (SPARC 2000), which cannot be explained by increases in
methane or trends in tropical tropopause temperatures (SPARC 2000). Because of the importance of water vapour for the
hydrogen budget of the stratosphere, there is a need to understand the balance of processes that govern the exchange of air
across the tropical tropopause. The roles of convection and stratospheric driven upwelling in stratosphere-troposphere
exchange are of interest chiefly because rapid convective injection may yield air with a much different chemical signature
than slow ascent, and may localise the injection of air into the stratosphere. In addition, given significant anthropogenic radiative
forcing, slow ascent (driven by extratropical wave driving) may change over time in a much different way than convection might
change (driven by low level tropical convergence and tropical near surface temperatures).
The concept of the tropical tropopause as a 'layer' rather than a single surface was discussed by Atticks & Robinson
(1983) and more recently by Highwood and Hoskins (1998). The tropical tropopause region or tropical tropopause layer (TTL)
is the region between the convective equilibrium of the troposphere, and the radiative equilibrium of the stratosphere. It is a
transition zone where both stratospheric and tropospheric processes interact. We will focus on the analysis of convection in
this transition layer. A convenient definition of this layer is the region between the main convective outflow (10-12km) and
the cold point tropopause.
It has long been known that deep convective clouds may penetrate the tropopause in mid-latitudes. In the tropics, there is
anecdotal evidence of even deeper convection penetrating the tropical tropopause. These convective events have been invoked
by Danielsen (1982) to explain the dehydration of the stratosphere by convective overshooting. More recently Sherwood and
Dessler (2001) illustrated how convection can dehydrate the tropopause region.
But how frequent is this deep and very cold convection in the tropopause region and above the tropopause? Drawing on recent
work using satellite data with global coverage (Gettelman et al., 2001) we will attempt to illustrate that convective
penetration of the tropopause does occur, but it is confined to specific regions and seasons. We also detail the penetration of
convection into the tropopause region. This leads to an integrated picture of how convection and subsequent horizontal transport
of air in the tropopause region set the “boundary condition” for air that enters the stratosphere.
To determine the position of deep convection in the tropopause region, cloud brightness temperatures observed from satellites
have been analysed by Gettelman et al. (2001). Satellite brightness temperature is represented at high space-time resolution in
Global Cloud Imagery (GCI), described by Salby et al. [1991]. This data set has a spatial resolution of ~0.5° (lat and lon),
every 3 hours. Pixels are derived from satellite infrared brightness temperature measurements with a footprint of 8km.
These data provide a qualitative description of optically thick cloud in the tropopause region. The uncertainty in actual height
for each observation is easily +/- 500m. The averaging of 8km observations does not appear to introduce a bias (see Gettelman
et al. 2001 for a more complete discussion). The advantage to the GCI data is to be able to cover the whole tropics, and to look at
the relative frequency of cloud top temperatures observed in different regions at different times of the year.
To examine cloud temperatures relative to the tropopause, the tropopause is defined using the WMO lapse rate criteria, and data
from the Reanalyses developed by the National Centers for Environmental Prediction (NCEP) and the National Center for
Atmospheric Research (NCAR). Comparing clouds to the position of the tropopause introduces uncertainties associated with
the tropopause temperature [Randel et al., 2000] and the modification and deformation of the local tropopause by the
overshooting clouds themselves. These clouds are colder than their environment. Thus these estimates of clouds in the
tropopause region do not represent permanent transport into the stratosphere, but rather the locations of a mixing process.
In this process convective air overshooting its level of neutral buoyancy will mix with some tropopause region air and sink
back down to a new equilibrium level.
Given these caveats, we present the following qualitative view of clouds reaching into the tropical tropopause region. Deep
convection occurs throughout the tropics, but in preferred regions. The analysis of brightness temperature from GCI enables
the complete convective pattern to be observed with global coverage and sufficient space-time resolution to capture the
dominant scales of organised convection. The analysis focuses on clouds in the tropopause region, that is, those clouds above
150 hPa. The 150 hPa level is climatologically at a temperature of about 215° K and the 340 K potential temperature
surface.
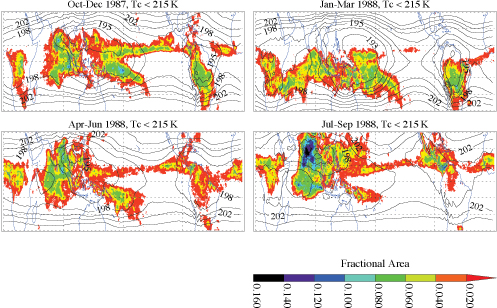
We define the fractional area with brightness temperature below some temperature in the GCI data as
hT, the fractional area coverage at some temperature T.
The fractional area with brightness temperatures colder than 215° K in the GCI data
(h215) is illustrated in Figure 1.
Seasonally averaged h215 has maxima over
the continents and the Inter-Tropical Convergence Zone (ITCZ) during local summer. In general, the summer hemisphere has
far more convective activity reaching 215°K than the winter hemisphere, and the maxima in fractional area coverage
are typically centred off the equator. The highest frequency of cold brightness temperatures at this level are associated
with the South Asian Monsoon in July--September, with values nearly as high over Central America during these same
months.
 |
||||
| Figure 1: Fractional area with brightness temperature colder than 215° K in GCI data (h215) for A) October-December 1986, B) January-March 1987, C) April-June 1987 and D) July-September 1987. Adapted from Gettelman et al. (2001). | ||||
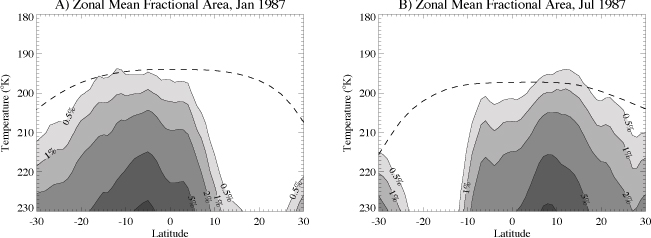
The zonal mean fractional area in the GCI data covered by clouds below various threshold brightness temperatures
(hT) is illustrated in Figure 2 for two months as
a function of latitude and temperature. The zonal mean tropopause temperatures are also plotted in Figure 2
(note that temperature decreases upward).
During both months, the fractional coverage at any temperature is a maximum in the summer hemisphere about
10° from the equator. The edge of winter storm activity in mid-latitudes is visible at 25-30° latitude
in the winter hemisphere. The tropopause is ~3°C colder during January (Figure 2a) than during July
(Figure 2b). In each month, a small fraction of cloud (~0.5%) does appear colder than the mean tropopause.
The maximum fractional coverage above the tropopause is larger in July (at ~12°N in Figure 2b) than
in January (at ~15°S in Figure 2a), which reflects the warmer tropopause temperatures, since the peak
zonal mean fractional coverage is about the same temperature in January and July. The fractional coverage above the
tropopause would be smaller if the (4°C) warm bias to the NCEP thermal tropopause is taken into account
(Randel et al. 2000), or if the cold point tropopause definition is used.
 |
||||
|
Figure 2: Zonal mean hT
(in percent) as a function of Latitude and Temperature for A) January 1987 and B) July 1987. Dashed line
is the zonal mean thermal tropopause. Adapted from Gettelman et al. (2001). |
||||
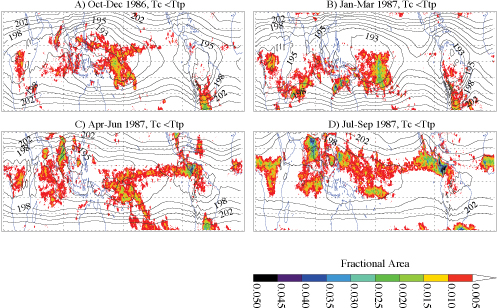
The distribution of clouds whose brightness temperatures are colder than the analysed tropopause is presented in
Figure 3. As discussed, this does not imply irreversible transport of air above the tropopause, only that clouds
overshooting their level of neutral buoyancy reach this level, where they may mix with some quantity of air before
returning to a lower equilibrium level. A clear annual cycle is visible in Figure 3. Convective events colder
than the tropopause are broadly found in the same regions as deep convective activity in Figure 1. The highest frequencies
of brightness temperatures colder than the tropopause temperature in Figure 3, as for those at lower levels in Figure 1,
are found over the Indian subcontinent and over Central America in July--September (Figure 3d). The region of
North-East India was studied and noted for its convective penetration events by Cornford and Spavins [1973]. Oceanic
convection penetrates the tropopause significantly in the central Pacific in January-March of this year (Figure 3b),
which was an El Niño warm event. High frequencies of clouds colder than the tropopause are found over the inter-tropical
convergence zones, and also over the convective regions of central Africa.
The distribution of convective events into the tropopause region falls off rapidly above the average level of neutral buoyancy,
which can be derived from the surface equivalent potential temperature and is approximately the 345 K potential temperature
level (Folkins et al. 2000). A very small fraction of this convection reaches tropopause levels, as expected from a small
proportion of locations with surface equivalent potential temperatures of 370-390 K. Very few individual locations see clouds
colder than the tropopause even 3-4% of the time (Figure 3). Even in regions of the most active convection, clouds
are colder than the tropopause less than 0.5% of the time (Figure 2). These observations are consistent with rapid dehydration
by a spectrum of convection penetrating into the tropopause region. Sherwood and Dessler (2001) have shown that the required
amount of convection necessary to dehydrate air to stratospheric levels (less than 10 ppmv) is at least within the range of
the frequency of convection reaching tropopause levels implied in the GCI data.
 |
||||
| Figure 3: Fractional area with brightness temperature colder than the tropopause in GCI data (hTP) for A) October-December 1986, B) January-March 1987, C) April-June 1987 and D) July-September 1987. Contours are seasonal mean tropopause temperature. Adapted from Gettelman et al. (2001). | ||||
In general, the maximum occurrence of brightness temperatures colder than the local tropopause temperature occurs in the summer hemisphere, consistent with the annual cycle of convection. Higher frequencies of cloud colder than the tropopause occur in July-September when tropopause temperatures are warmer than in January-March.
Given the distribution of convection in time and space it is natural to ask how it is related to the transport of air into the
tropopause region and into the stratosphere. Note that in Figure 2 and Figure 3 that convection colder than the tropopause
occurs mostly in the summer hemisphere, and more occurs in August than in February. If convection was the major process
governing the entry of water vapour into the stratosphere, then we might expect the water vapour minimum to be in
July-September rather than in January-March as observed.
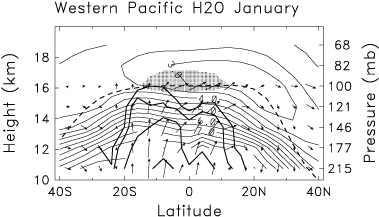
To investigate this discrepancy further, we look at the relationship between convection, temperature and water vapour in the tropopause region. We choose January for this comparison as the month with the coldest averaged tropopause temperature s and lowest averaged water vapour. Figure 4 links the frequency of convection averaged zonally over the western Pacific with cold point temperatures below 188° K (shaded region), regionally averaged tropopause temperatures (dashed line), NCEP/NCAR reanalysis winds (vectors), and water vapour observations (contours) derived from the HALOE instrument on the UARS satellite (Randel et al., 2001). There is a spatial separation in Figure 4 between the deepest convection and the lowest water vapour concentrations. While the deepest convection is south of the equator in the summer hemisphere, the lowest concentrations of water vapour are centred about 15° north of the equator in the winter hemisphere. The minimum descends slightly in the subtropics, consistent with the wind vectors indicating the northward flowing upper branch of the Hadley circulation. These winds imply transport along isentropic surfaces (which slope downward and poleward in this region). The coldest temperatures, unlike the convection, are nearly symmetric around the equator. A picture similar to Figure 4 (though with higher absolute concentrations of water vapour) can also be generated for July, with a water vapour minimum south of the equator, and more convection north of the equator (Figure 2).
Figure 4 hints at some interesting relationships between these fields. This integrated picture implies that both vertical and horizontal motion are important for understanding the distribution of water vapour, since the minimum in water vapour just above the tropopause is well away from convection. One explanation for the water vapour minimum north of the equator is that the rapid horizontal transport of air through very cold regions dehydrates air further as it slowly ascends. This slow ascent is due to radiative heating in the tropopause region and the stratospheric circulation, and a characteristic vertical velocity is on the order of mm/s, in contrast to m/s horizontal velocities. Such a process would help explain the presence of widespread thin sub-visible cirrus clouds (Wang et al. 1996). Space based LIDAR measurements suggest that in many cases these cirrus are not obviously related to convection (Winker and Trepte 1998). The generation and maintenance of these cirrus are not well characterised, but Holton and Gettelman (2001) have recently shown using a simple model that horizontal motions in the tropopause region can dehydrate air and generate cirrus clouds, even in the presence of the reported subsidence in the cold regions of the western Pacific (Sherwood, this issue). In addition to the large-scale temperature fields, small-scale temperature perturbations due to waves (Boehm and Verlinde 2000) may also be important.
The question of what causes the regional distribution of tropopause temperatures is still uncertain. While the seasonal variation of zonal mean tropopause temperatures should be set by the residual circulation of the stratosphere (Holton et al. 1995), Johnson and Kriete (1982) demonstrated using radiosondes during MONEX that convection itself has a significant impact on tropopause temperatures. Cooling following mixing with convective air is also consistent with observed and modelled downward motions in the tropopause region (see Sherwood, this issue).
 |
||||
| Figure 4: Western Pacific (100-180 longitude) mean: fractional area coverage of clouds colder than a given brightness temperature (thick contours at 10%, 5%, 2%, 1%), water vapour observed by HALOE in ppmv (thin contours), and NCEP/NCAR areal averaged kinematic velocities (vectors, scaled to motion in one day). Shaded region indicates regional monthly mean temperatures below 188° K. Adapted from Randel et al. (2001). | ||||
Satellite brightness temperatures locate convection in the Tropical Tropopause region, and indicate the frequency of convection
colder than the local tropopause. These results are qualitatively consistent with the few available observations.
The coupling of convection with observations of water vapour, temperature and wind fields allows us to better understand
the role of convection in the tropopause region. Convection supplies much of the air into the tropical tropopause region, but
subsequent horizontal transport of air is also important for understanding how air enters the stratosphere, and with what
water vapour concentration. Observations imply that there is dehydration in the tropopause region away from convection.
What does this integrated picture mean for trends in water vapour? Tropopause level water vapour appears determined
(to first order) by the tropopause temperature. This temperature is regulated by convection and the uplift and heating
associated with the stratospheric circulation. The details of the water vapour distribution might be sensitive to horizontal
motion in the tropopause region. Furthermore, the magnitude, level and temperature of the convective influx into the
tropopause region also affect the supply of water vapour and perhaps constrain its final value. Mixing of convective air
is also likely to affect the tropopause region. Two other important processes affecting the entry of air into the stratosphere
that have not been discussed here are isentropic mixing from the stratosphere into the tropical tropopause region, and
changes in the circulation in the lower stratosphere above the tropopause.
These results can be tested with more advanced instruments than the infrared measurements on operational polar orbiters
and geosynchronous platforms (which comprise the GCI data). These instruments include the radiometers and radars on
the TRMM satellite (currently flying), and chemical and cloud sensors like HIRDLS and MLS on EOS-AURA (launch in 2003)
and the LIDAR on PICASSO-CENA (also launch in 2003). In addition to these new sensors, interpretation of these observations
would be aided by a better understanding of the radiative environment in the tropopause region, and the physics surrounding
clouds that overshoot their equilibrium level. While the annual cycle of tropopause temperature is broadly understood, and
the basic large-scale response of the tropopause to convective heating in the troposphere is fairly well described, the
effect of deep convection on the local radiation balance in the tropopause region and above is not well constrained. In addition,
the cloud scale dynamics and radiation will likely interact to help determine how the deepest convection evolves, and how
it affects the thermodynamics of the tropopause region. Detailed observations from a field campaign in the tropics can be
used in conjunction with this comprehensive suite of satellite observations to answer both the small and large-scale
questions raised by this coarse picture of the tropopause region.
M. G. Atticks and G. D. Robinson. Some features of the structure of the tropical tropopause. Q. J. R. Meteorol. Soc., 109(460):295-308, 1983.
M. T. Boehm and J. Verlinde. Stratospheric influence on upper tropospheric tropical cirrus. Geophys. Res. Lett., 27(19):3209-3212, 2000.
S. G. Cornford and S. Spavins. Some measurements of cumulonimbus tops in the pre-monsoon season in north-east India. Met. Mag., 102:314-332, 1973.
E. F. Danielsen. A dehydration mechanism for the stratosphere. Geophys. Res. Lett., 9:605-608, 1982.
I. Folkins, S. J. Oltmans, and A. M. Thompson. Tropical convective outflow and near surface equivalent potential tempratures. Geophys. Res. Lett., 27(16):2549-2552, 2000.
A. Gettelman, M. L. Salby, and F. Sassi. The distribution and influence of convection in the tropical tropopause region. submitted to J. Geophys. Res., 2001.
E. J. Highwood and B. J. Hoskins. The tropical tropopause. Q. J. R. Meteorol. Soc., 124(549):1579-1604, 1998.
J. R. Holton, P. H. Haynes, A. R. Douglass, R. B. Rood, and L. Pfister. Stratosphere-troposphere exchange. Rev. Geophys., 33(4):403-439, 1995.
J. R. Holton and A. Gettelman. Horizontal transport and dehydration in the stratosphere. in press, Geophysical Research Letters, 2001.
R. H. Johnson and D. C. Kriete. Thermodynamic and circulation characteristics of winter monsoon tropical mesoscale convection. Mon. Weather Rev., 110:1898-1911, 1982.
W. J. Randel, F. Wu, and D. J. Gaffen. Interannual variability of the tropical tropopause derived from radiosonde data and NCEP reanalyses. J. Geophys. Res., 105(D12):15,509-15,523, 2000.
W. J. Randel, A. Gettelman, F. Wu, J. M. Russell III, J. Zawodny, and S. Oltmans. The seasonal variation of water vapour in the lower stratosphere observed in HALOE data. J. Geophys. Res. in press, 2001.
M. L. Salby, H. H. Hendon, K. Woodberry, and K. Tanaka. Analysis of global cloud imagery from multiple satellites. Bull. Am. Meteorol. Soc., 72(4):467-480, 1991.
S. C. Sherwood and A. E. Dessler. A model for transport across the tropical tropopause. J. Atmos. Sci., 58:765-779, 2001.
SPARC. Assessment of Water Vapour in the Upper Troposphere and Lower Stratosphere. SPARC report 2, WMO TD1043. Stratospheric Processes and Their Role In Climate, World Meteorological Organization, Paris, 2000.
P. H. Wang, P. Minnis, M. P. McCormick, G. S. Kent, and K. M. Skeens. A 6-year climatology of cloud occurance frequency from Stratospheric Aerosol and Gas Experiment II observations (1985-1990). J. Geophys. Res., 101(D23):29,407-29,429, 1996.
D. M. Winker and C. R. Trepte. Laminar cirrus observed near the tropical tropopause by LITE. Geophys. Res. Lett.,
25(17):3351-3354, 1998.
![]()