 |
Stratospheric Processes And their Role in Climate
|
||||||||
| Home | Initiatives | Organisation | Publications | Meetings | Acronyms and Abbreviations | Useful Links |
![]()
|
Stratospheric Processes And their Role in Climate
|
||||||||
| Home | Initiatives | Organisation | Publications | Meetings | Acronyms and Abbreviations | Useful Links |
![]()
APE-GAIA (Airborne Polar Experiment -Geophysica Aircraft In Antarctica, Carli et al. 1999) has obtained interesting new information on the stratospheric chemistry and transport during the transition of the southern polar vortex from the ozone depletion to the recovery phase. The mission with the high-altitude aircraft M-55 Geophysica took place from 15 September to 15 October 1999 when five scientific flights were performed from Ushuaia ( 55°S, 68°W). A comprehensive payload of remote-sensing and in-situ instruments monitored an essentially unexplored altitude range of the vortex. Flying southward over the Antarctic Peninsula at latitudes up to 70°S and at altitudes from 14 to 20km, while probing the vertical distribution with remote sensing techniques and occasional 'dives', allowed to investigate the main targets of the mission (Carli and Blom, 1997):
The planning of the flights was first based on the relevant scientific objectives (M. P. Chipperfield and G. Redaelli, 1999). Individual flight plans were then finalised using detailed forecasts. These forecasts included standard output from global numerical weather prediction models, as well as high resolution trajectory/contour advection models (to identify air filaments), lee wave models (to identify mountain wave PSCs) and global chemistry transport models. The use was also made of near real-time TOMS column O3 data.
The M55-Geophysica aircraft has become available for scientific purposes in the frame of a co-operation between the Italian National Programme for Antarctic Research (PNRA) and the Russian Myasishchev Design Bureau (MDB), AviaEcoCenter (AEC), and Central Aerological Observatory (CAO) of Moscow. The first mission (APE-POLECAT) was held out of Rovaniemi, Finland, in winter 1996/97 (Stefanutti et al., 1998). More recently, the Geophysica was used in the APE-THESEO campaign (MacKenzie et al., 2000) to study transport and clouds at the tropical tropopause. With respect to these missions, APE-GAIA deployed a new payload that combined for the first time several instruments for the study of atmospheric chemistry. The earlier US-American ER-2 deployments AAOE (Tuck et al., 1987) and ASHOE (Tuck et al., 1997) demonstrated the importance of high-altitude aircraft for research in and around the southern polar vortex. The large payload capacity of the Geophysica, as well as its operational flexibility and manoeuvrability have offered, however, a new opportunity for observations above Antarctica. The capability for housing relatively large and heavy sensors (up to a maximum weight of 1500kg and to a volume larger than 11m3) has allowed the deployment of a large payload of remote-sensing and in-situ instruments aboard a single stratospheric aircraft. This, along with the fact that the Geophysica is able to fly at various altitudes, within cold air masses (temperature around -90°C), with deep dives, and to operate despite difficult ground conditions (strong cross wind), significantly advanced the scientific output of APE-GAIA. In this paper a short description of the campaign and some preliminary results are presented.
The scientific payload of the M55 aircraft during the Antarctic campaign is summarised in Table 1. It includes remote sensing and in-situ equipment for gaseous trace compounds, instruments aimed at characterising aerosols and cloud particles, and devices for radiation measurements. The remote sensing chemistry instruments are the core of this payload as they provide simultaneous measurements of a large suite of chemical species. The two Fourier Transform Spectrometers MIPAS-STR and SAFIRE-A make limb and upward soundings to obtain column amounts above the aircraft and profiles below. Together they cover the main components of the Cly family (ClO, HCl and ClONO2), MIPAS-STR almost covers the entire NOy family, whereas SAFIRE-A obtains information on Bry. GASCOD-A uses the DOAS technique and measures total amounts of the trace constituents at zenith and nadir in the case of high sun, and vertical profiles in the case of sunrise and sunset. Important active species observed by this instrument are OClO and BrO. The three instruments also observe several long-lived source gases. Their redundant measurements allow validation of the individual measurements. In situ instruments provide measurements of ozone, water vapour and long-lived tracers at flight altitude with high spatial resolution. From these measurements vertical distributions can be observed during dives of the aircraft. The horizontal variability of the atmospheric composition and the dynamics of the mixing can be derived during flights at constant altitude ensuring an important synergy with the more extended vertical maps that the remote observations provide on the basis of the assumption of horizontal homogeneity. Aerosols and PSC particles are detected and characterised by lidars and scatterometers pointing at different directions and operating with different ranges and different longitudinal resolutions. Correlation of PSC detection with the measurements of atmospheric composition simultaneously made by the chemistry payload provides an opportunity for the direct analysis of the effects of PSC formation (denitrification, dehydration, heterogeneous chemistry). Finally, two instruments provide measurements of radiation fluxes for a more precise quantification of photochemical parameters.
Figure 1 shows a map of the five flights performed from Ushuaia. The flight route and timing of each flight were determined on the basis of stratospheric meteorological forecast complemented by high resolution reverse domain filling trajectories (RDFT) maps (Sutton et al., 1994) and MM5 mesoscale fields (Ferretti et al. 2000) and were verified with an early alert of the flight opportunities made possible by ground weather forecast.

Figure 1. Map of the test flight and the five scientific flights performed by the M-55 Geophysica from Ushuaia (Argentina) during the APE-GAIA mission.
The modelling activities provided, in forecast mode, accurate information about the location of the boundaries of the polar vortex, occurrence of lee waves and formation of filaments eroded from the vortex edge. Three flights aimed at entering as deep as possible inside the polar vortex and at performing dives inside, one of them reaching down to almost the tropopause. This type of flight was repeated more than once in order to study the chemistry of the polar air and the mixing between polar vortex and middle latitude air at different times as a function of the season and with slightly different vertical coverage. One flight was performed inside a major event of lee wave formation over the Antarctic Peninsula, and one flight route crossed twice a filament eroded from the vortex edge. The flight planning took into account also the requirements of the different instruments, such as night time versus day time preference, constant versus variable altitude, and solar blinding effects. A compromise was always found and the heterogeneous character of the techniques allowed the simultaneous measurement of many different parameters with a major enhancement of the acquired information, even if some instrument with specific requirements was not always able to perform measurements during the whole flight.
Figure 2 shows an example of observations made by the in-situ instruments on 23 September. As shown by the top plot, the altitude was about 17km in the forward (southbound) leg. While maintaining the southbound direction, a dive was performed down to 14km. After regaining altitude, the reverse (northbound) flight was performed, with two steps at 18km and at 19km. The first part of the flight was at night-time and the second in the day-time with sunrise occurring during the dive. Most species were observed by a single instrument, but in the case of ozone (bottom plot) two independent measurements are superimposed and show very good agreement. Ozone, water vapour and most tracers have very similar variations both in the general shape of the curves as well as in some small features. A rapid drop of concentrations synchronously observed for most species can be considered to identify the crossing of the vortex edge. From the figure one infers that during this particular flight the vortex edge was situated at 60°S on the forward leg (17km altitude), but at 62°S during the return leg (19km altitude). The changing latitudinal location of the vortex edge and gradients near it were also observed during other flights.
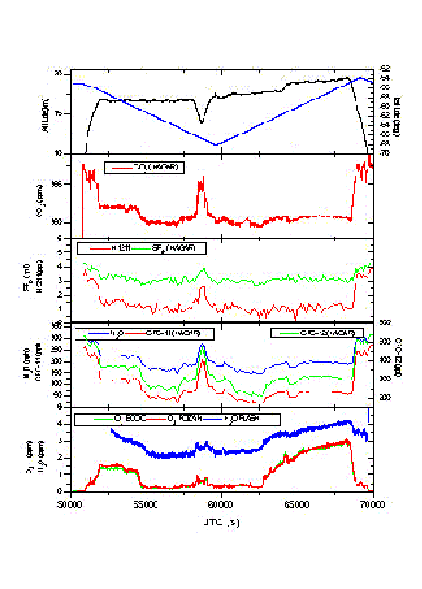
Figure 2. Altitude, latitude and in-situ measured minor constituents acquired during the flight of 23 September 1999. The measurements are preliminary.
Together with the in-situ measurements shown in Figure 2, during the same flight vertical profiles of several minor constituents were observed by the remote sensing instruments as a function of latitude. A clear anti-correlation was observed by SAFIRE-A between ozone and ClO, the latter being detected only in the reverse leg in the daytime. A comprehensive analysis is still in progress. As an example of the detail of the information and of the remaining data analysis activities required for the remote sensing instruments, Figure 3 shows a comparison between the measurements of HNO3 made with SAFIRE-A and MIPAS-STR. Colour-contour plots are used for the comparison of the two measurements performed on different grids in the altitude-latitude domain. A simplified and possibly incomplete spectroscopic data base is used in the case of SAFIRE-A, and temperature profiles provided by models instead of those directly measured are used in the case of MIPAS-STR. Furthermore, some gaps were present in the data acquisition of the two instruments during this particular flight and different regularisation and determination of the distribution above the flight altitude were operated in the two retrievals.
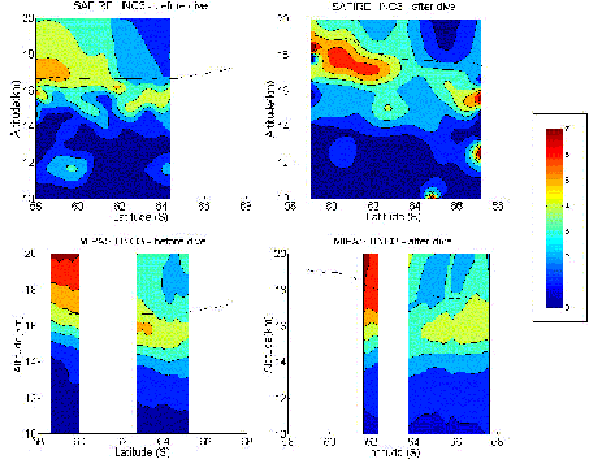
Figure 3. The volume mixing ratio [ppb] of nitric acid as a function of altitude and latitude for two remote sensing instruments and the two legs of the same flight of 23 September 1999. The continuous line shows the flight altitude. The measurements are preliminary.
Despite the fact that some differences are observed both between the two instruments and between the forward and reverse legs of each instrument, the overall distributions are quite consistent. At latitudes less than 63°S, HNO3 is mainly observed at altitudes above 16km, there is a reduction of HNO3 concentration around 64°S and the distribution peaked at 16km at latitudes higher than 65° The lower altitude of the HNO3 maximum with increasing latitude is in agreement with the expected effect of the sedimentation process. The differences observed between the forward and the reverse legs could also be due to the atmospheric variability since the aircraft followed the same track in the two legs and the remote instruments looked on the two
sides at air masses that are up to 500km apart. A detailed analysis of the results obtained by the two instruments will validate the observed differences and provide a better understanding of the atmospheric variability.
With an alert of about 36 hours, the model predicted lee wave formation over the Antarctic Peninsula for 2 October 1999. A flight route was accordingly aimed at probing the temperature oscillations and observing the induced effects in the atmosphere. Measurements made during that flight are shown in Figure 4, which displays a comparison of the back-scattering signal measured above the aircraft by MAL-1 and the local temperature as a function of time. The back-scattering signal is corrected for the aircraft altitude and placed at the correct relative position in the atmosphere. The very low ambient temperature made it difficult for the aircraft to maintain a constant altitude. The temperature profile along the flight track shows clearly some oscillations, at different frequencies, with the major amplitudes well matched in time and space with the forecast temperature fields. The PSC occurrences are also well correlated with local temperature minima.
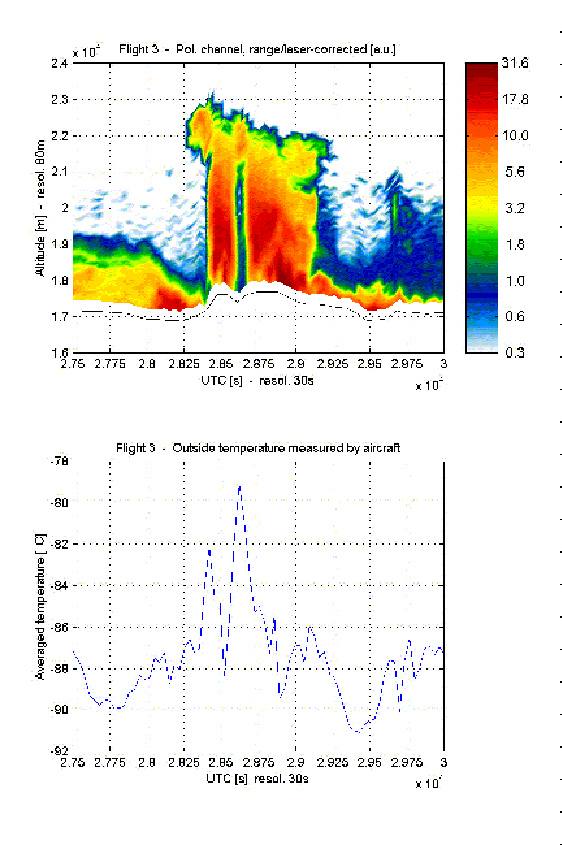
Figure 4. Observations of the MAL instrument during the flight of 2 October 1999 in the area in which lee wave formation was forecast. The upper panel presents the altitude profile of the back-scattering signal, the lower panel presents the temperature of the atmosphere at the flight level.
From high resolution RDFT fields, an air filament was forecast for 8th October 1999, between Argentina and the Antarctic Peninsula. The signature of the filament was already clearly present in the RDFT forecast products 96 hours in advance. In order to verify and study the occurrence of this structure, a flight was planned, with a four legs track on two isentropic surfaces: 390K and 450K. As forecast, while flying quasi isentropically at 450 K, the aircraft observed intense and localised variations of the tracers, supposedly related to the sampling of the vortex filament structures. Also, the RDFT products (not shown here) picture a three-dimensional filament with strong horizontal gradients, large vertical depth and high resolution internal structure that seems to correspond well to the preliminary analysis of the time series of the experimental data. Further analyses involving the complete set of tracer data available from onboard instrumentation are needed to have a more complete understanding of this case.
In parallel to the Geophysica flights, a series of correlative ground-based and balloon measurements were made from different sites located in Tierra del Fuego and on the Antarctic Peninsula. Ground-based ozone, NO2, SO2 and UV radiation measurements were carried out at Ushuaia. On the Antarctic Peninsula, real-time measurements of total ozone and NO2 were obtained from the base of the British Antarctic Survey in Rothera (67° 34' S; 68° 07' W), along with radiosonde launches and ozone soundings. Total column ozone values were obtained from the Argentinean bases of Marambio (64°23' S, 56°72' W) and Belgrano II (77° 52' S; 34° 37' W), the activities in the former base being performed in collaboration with the Finnish Meteorological Institute. At these two bases, ozone and NO2 measurements were also obtained by the INTA (Spain) and CNR-IFA (Italy). A preliminary comparison of the ozone measurements made at Marambio and from the aircraft during a dive made nearby during the flight of 8 October show very similar shape, but some quantitative difference in the amplitude of the ozone variability. The different resolution and coverage of aircraft and ground based observation makes the comparison difficult, but enlarges significantly the comprehensiveness of the acquired picture.
The transfer flights of the Geophysica from Europe to South America and reverse made it possible to explore the upper troposphere and lower stratosphere over a wide range of latitudes, and to study the interactions between the polar vortex and the mid-latitude stratosphere. These measurements were very demanding from the logistical point of view. The limited range of the M55 required the transfer flights to be completed in four legs. However, access to the instruments was only possible at the airport of Recife (Brazil), with no access during the other two short stopovers. For this reason, the instruments had to operate and store data for a period of 14 hours of unattended operation. During the transfer flights auxiliary measurements were provided from Buenos Aires, Mar del Plata, Sal Island and Izana (Canary Islands).
APE-GAIA has been a major international collaboration. About 70 scientists, engineers and technicians worked in Ushuaia during the campaign, and almost as many at other locations were involved, contributing with models, data analysis, auxiliary measurements and logistic organisation. A total of nine countries (Italy, Russia, Germany, United Kingdom, Switzerland, Finland, Spain, Argentina, United States) participated in the project. The M-55 stratospheric aircraft operated successfully from the base of Ushuaia in Argentina with a comprehensive set of new instruments. Thorough forecast modelling allowed accurate planning of the observations aimed at the exploration of the edge of the polar vortex, and the probing of lee waves and air filaments. The timely operation of both the aircraft and the instruments ensured the operative success of the campaign. The conflicting measurement requirements of the different observing methods have only marginally reduced the productivity of the single instruments while ensuring a unique wealth of complementary information. The features of the vortex edge were probed at different altitudes with the simultaneous measurement of a large number of tracer species. Patterns of minor constituent distributions were observed as a function of altitude and latitude by the remote sensing instruments. An example has been shown in the case of HNO3 in which strong indications of sedimentation effects are observed. The formation of dense clouds of ice particles was observed at 20km altitude in the cold regions generated by orographic waves above the Antarctic mountains. A filament of polar vortex air was forecast and then sampled by the Geophysica. The flights from Moscow to Ushuaia and back were used to perform further scientific measurements over a wide latitude range. The bulk of the data will require an elaborate analysis process (comparisons between the instruments, testing of the consistency of the models with the observations, etc). It is believed that the campaign has provided important new information on the dynamics of the vortex and on the processes controlling ozone in the atmosphere that will improve our estimates of Antarctic ozone recovery time after the phasing out of CFCs
We gratefully acknowledge the support of PNRA (Programma Nazionale di Ricerche in Antartide), which started the project in 1995 in collaboration with the Russian Myasishchev Design Bureau, and funded most of the aircraft preparation and campaign activities. The project was possible also thanks to the contributions of several national and European research agencies such as ASI (Agenzia Spaziale Italiana), CNR (Consiglio Nazionale delle Ricerche, Italy), PSTdA (Parco Scientifico e Tecnologico díAbruzzo, Italy), BMBF (Bundesministerium für Bildung, Wissenschaft, Forschung and Technologie, Germany), NERC (U.K. Natural Environment Research Council), Royal Society (U.K.), OFES and FNRS (Switzerland), ESF (European Science Foundation), EU (European Union), which concurred in the development of new dedicated instrumentation, in the execution of intermediate campaigns and in the support of the campaign participation. The mission would not have been possible without the assistance and help of numerous hosting organisations and individuals, to whom we wish to express our gratitude.
Carli, B., Cortesi, U., DeRossi, G., Airborne Polar Experiment Geophysica Aircraft In Antarctica (APE-GAIA): A remote sensing chemistry mission, Proc. of the Fourth Internat. Airborne Remote Sensing Conf., 21st Canadian Symp. on Remote Sensing, Ottawa, Canada, 21 - 24 July 1999.
Carli, B., Blom, C. E., Scientific Objectives for the APE Chemistry Mission to Antarctica, internal planning paper for PRNA, 1997.
Chipperfield, M. P., Redaelli, G., Science Issues and Teorethical/Modelling Work for APE-GAIA, internal report, 10 September 1999.
Ferretti, R., Paolucci, T., Zheng, W., Visconti, G, Bonelli G., Analyses of the precipitation pattern on the Alpine region using different cumulus convection parameterizations, J. App. Met., 39, 182- 200, 2000.
MacKenzie, R, et al., APE-THESEO: Clouds, dehydration, and transport at the tropical tropopause, SPARC Newsletter n.14, 18, 2000.
Stefanutti L., et al., APE-POLECAT - Rationale, Road Map and Summary of Early Results, JGR, Vol. 104, D19, 23941-23959, 1999,
Sutton, R.T., MacLean, H., Swinbank, R., O'Neill, A., Taylor, F. W., High resolution stratospheric tracer fields estimated from satellite observations using lagrangian trajectory calculations, J. Atmos. Sci., 2995-3005, 1994.
Tuck, A. F., et al., The Planning and Execution of the ER-2 and DC-8 Aircraft Flights Over Antarctica, August and September 1987, JGR, 94, pp. 11181-11222, 1989.
Tuck, A. F., et al., Airborne Southern Hemisphere Ozone Experiment/ Measurements for Assessing the Effects of Stratospheric Aircraft (ASHOE/ MAESA): A road map, JGR, 102, 3901-3904, 1997.
![]()