![[MOPITT Logo]](moplogo.gif)


![]()
Carbon Monoxide from California Fires
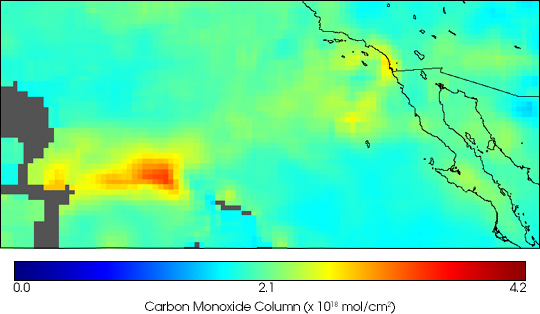
The data were taken by the Measurements Of Pollution In The Troposphere (MOPITT) instrument aboard NASA’s Terra satellite for the period October 26-31, 2003.
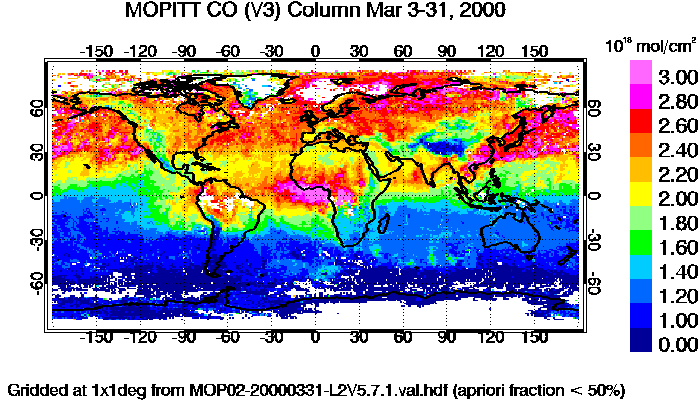
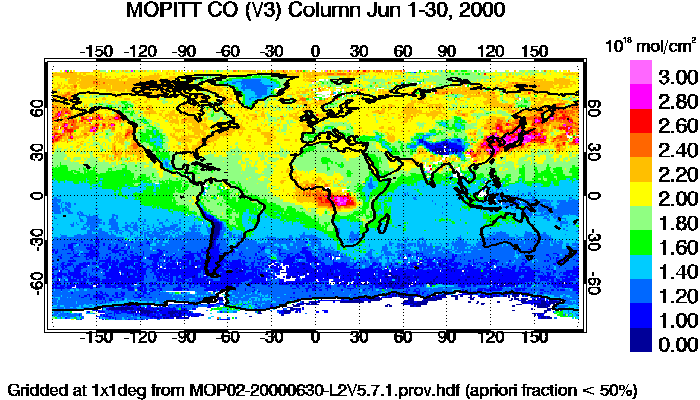
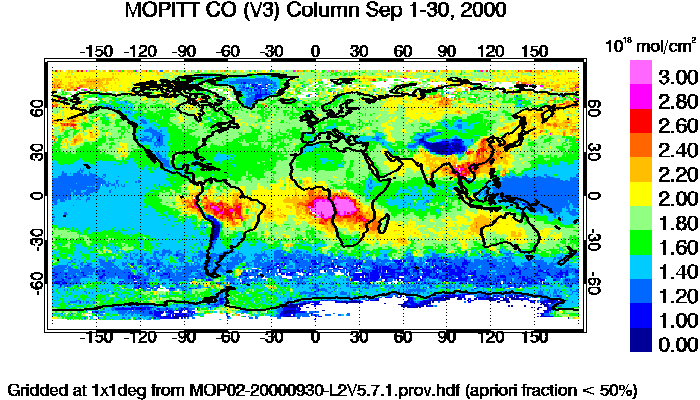
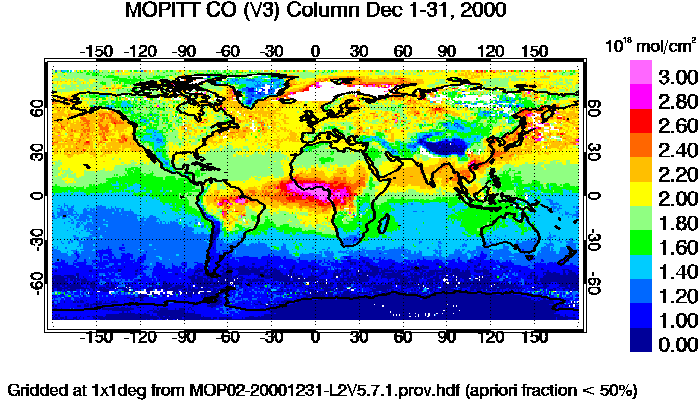
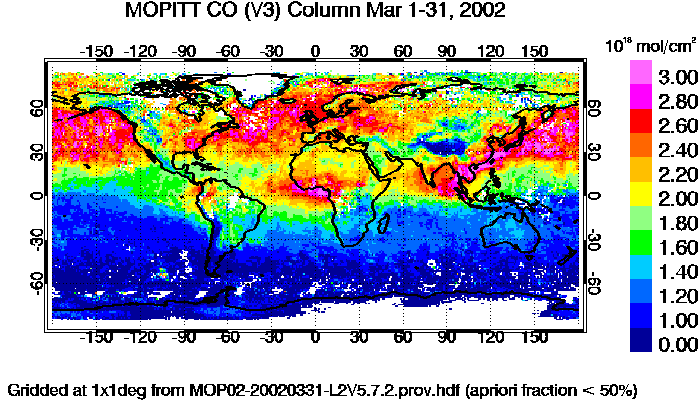
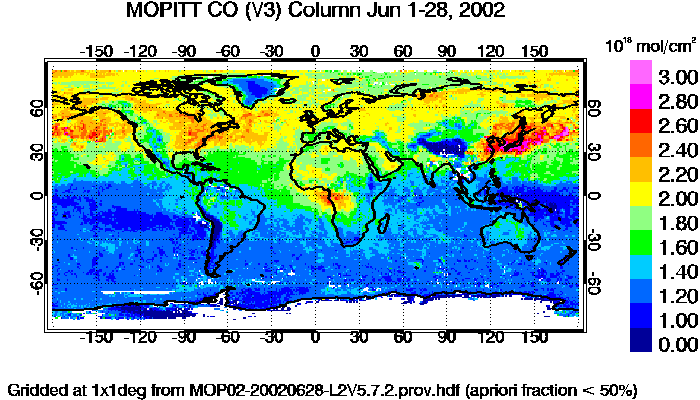
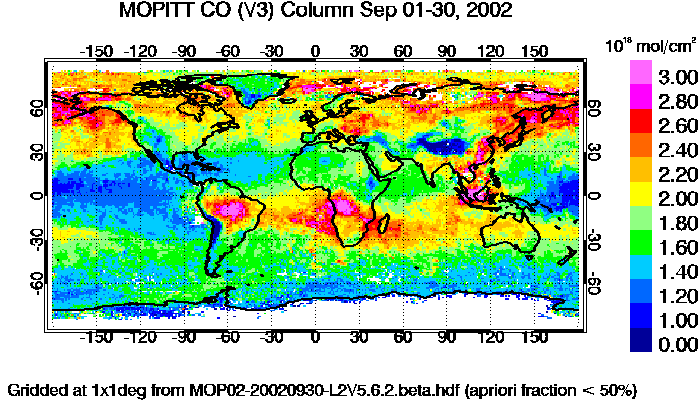
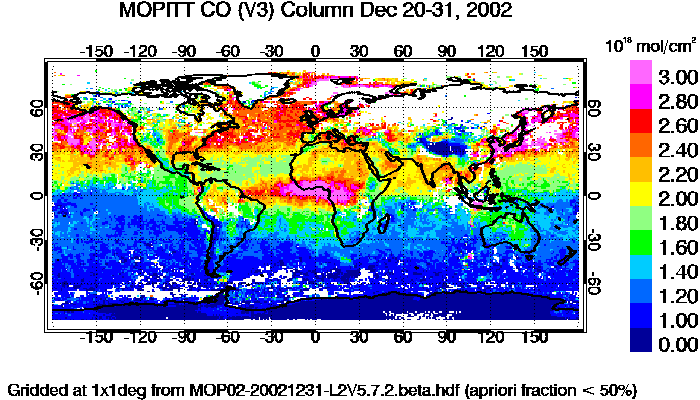
Carbon Monoxide
Seasonal variations
|
2000 & 2002 March |
June |
September |
December |
 |
 |
 |
 |
 |
 |
 |
 |
Carbon Monoxide
Altitude variations
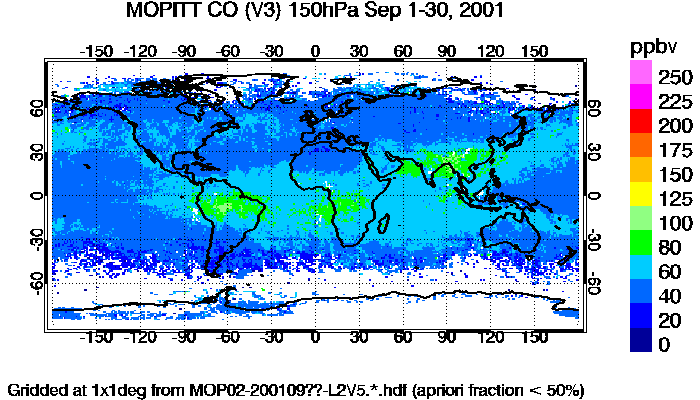 |
150 hPa | 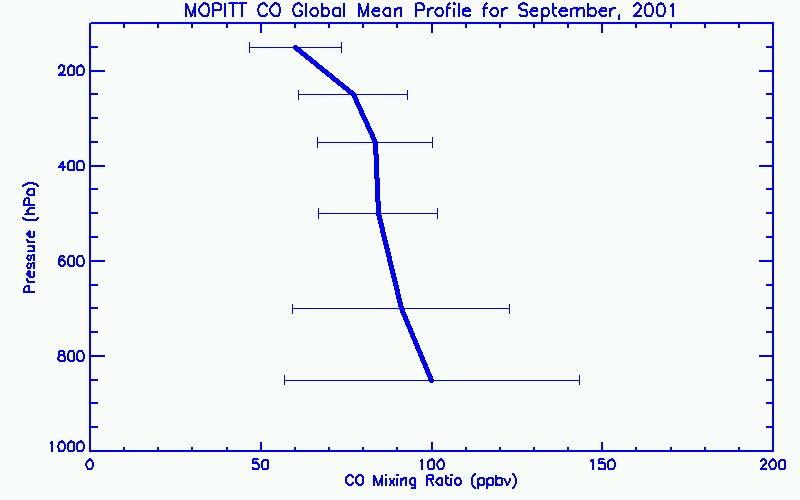 |
|
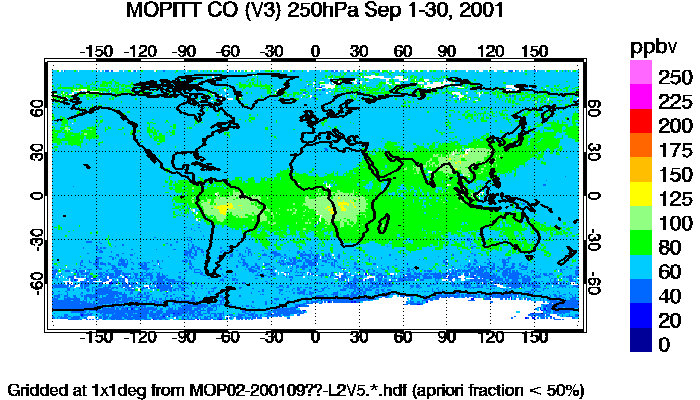 |
250 hPa | ||
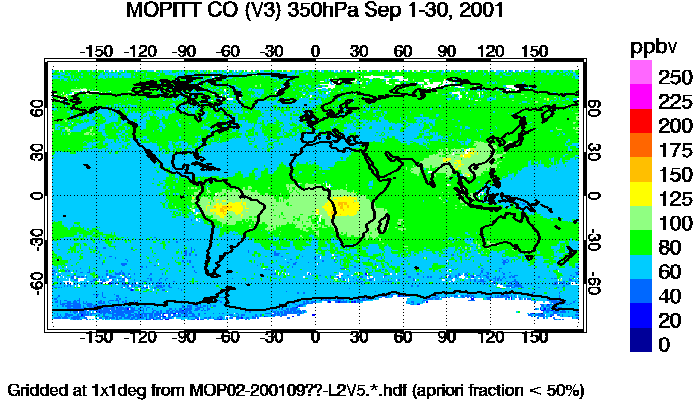 |
350 hPa | ||
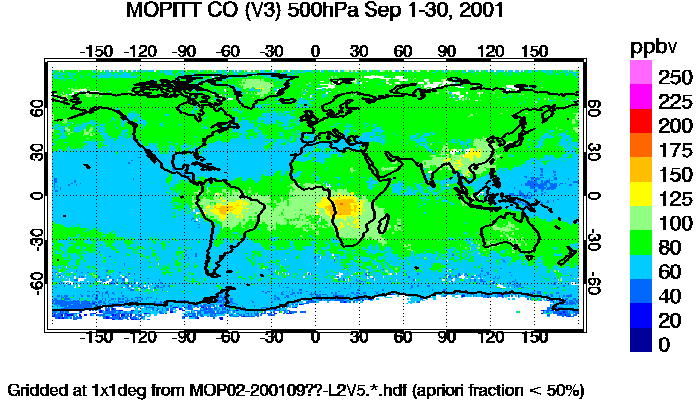 |
500 hPa | ||
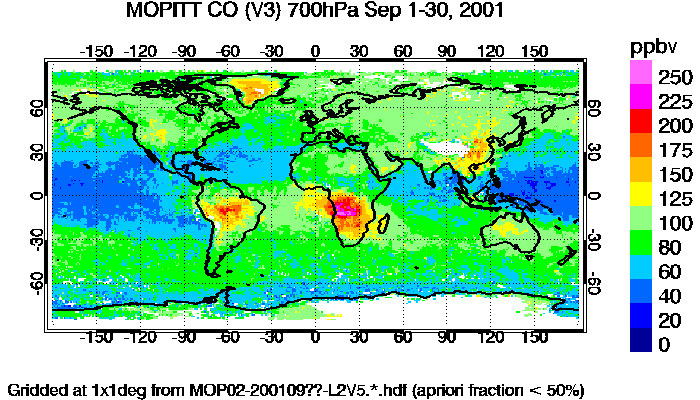 |
700 hPa | ||
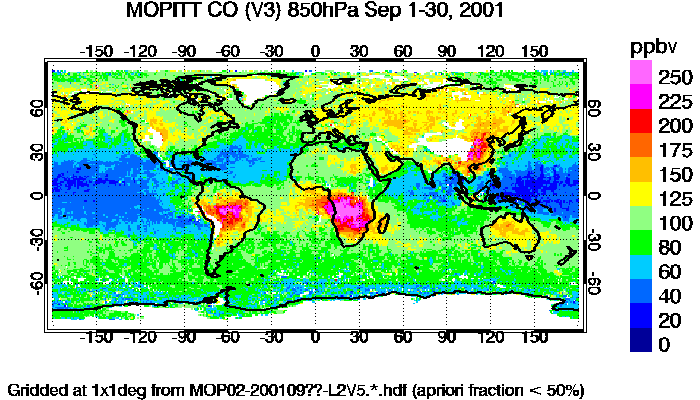 |
850 hPa |
| 15-17 Febr.2002 | 15-17 May 2002 | 15-17 Aug 2002 | 15-17 Nov 2002 | |
| Bottom Temperature | ||||
| Bottom Pressure | ||||
| Bottom Emissivity |
MOPITT
more than 3 YEARS
Long Trend Plots
|
|
 |