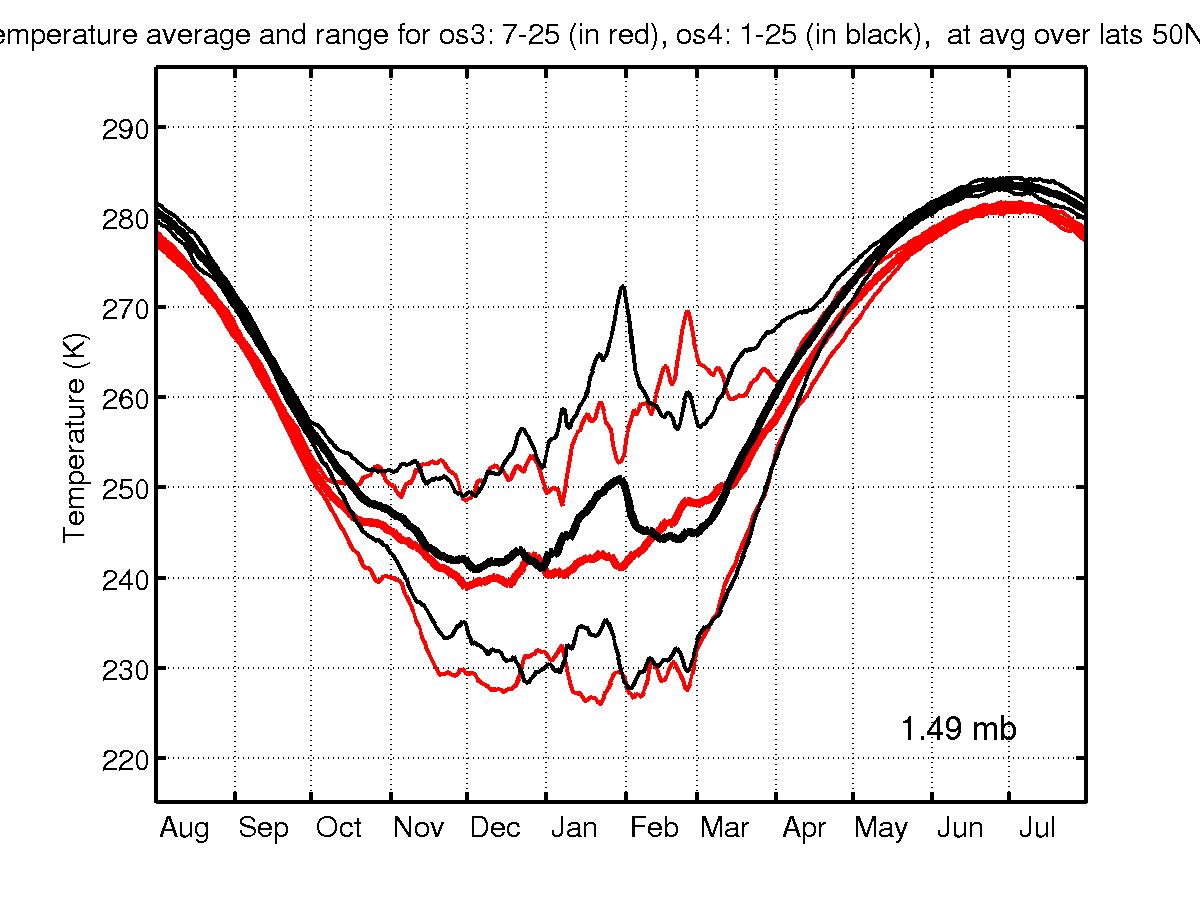
Comparisons of os3 vs. os4 (os4 = control run):
Temperature averaged (weighted by cos(latitude)) over 50N-90N, at 1.49 mb:
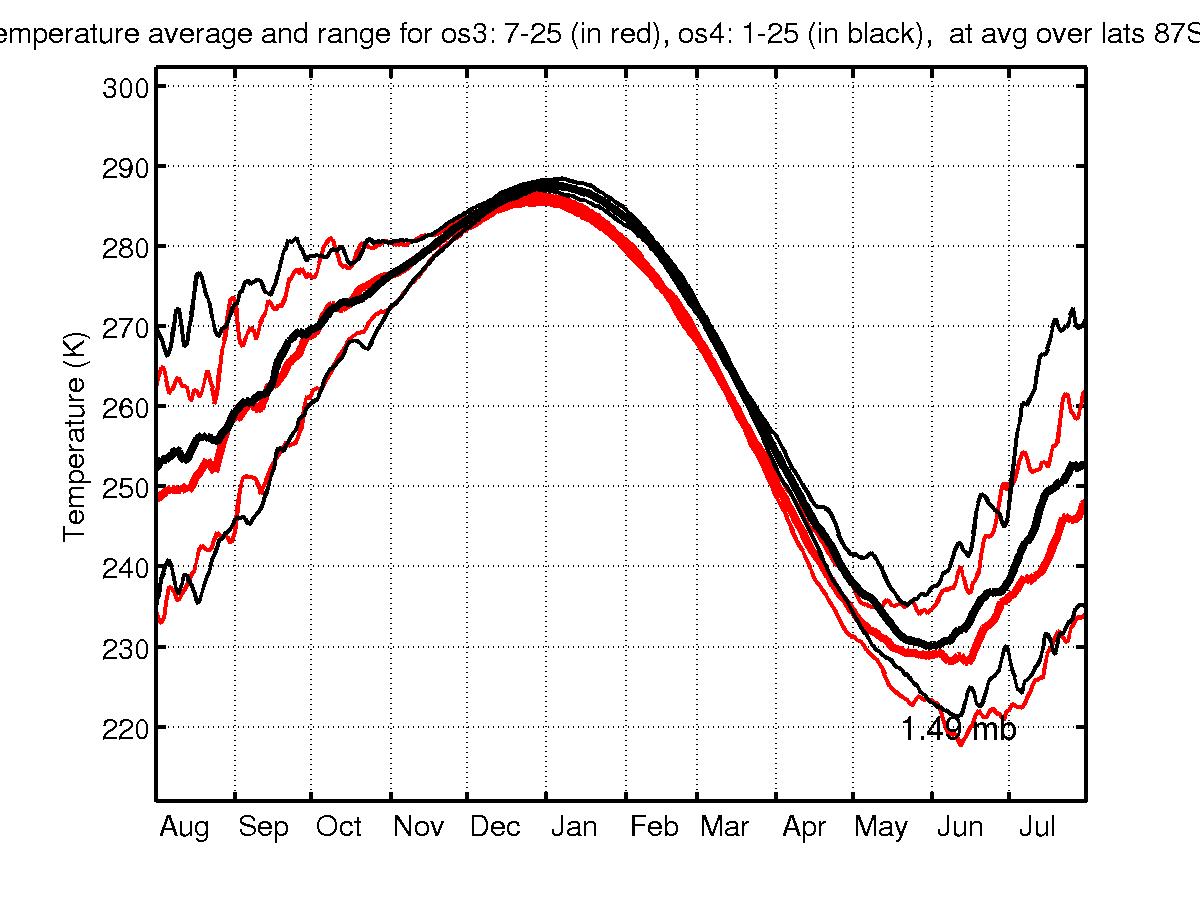
And the same but for 50S-90S:
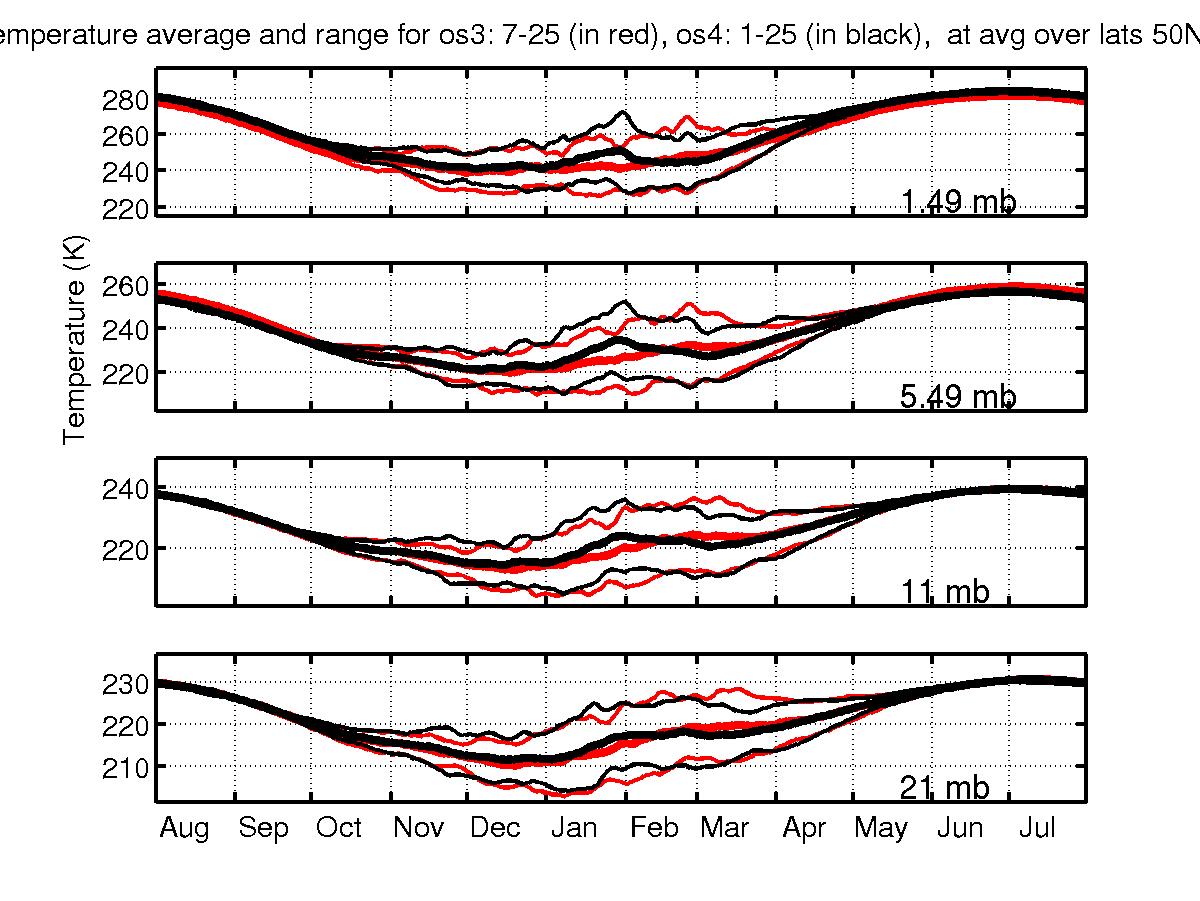
Here are the same latitude ranges used for the averaging, but now four vertical
levels are shown. The difference in summer temperature only occurs for the
top two levels (I haven't looked at levels higher than 1.49mb). The difference
doesn't occur for os2 vs. os4 (or for or1 vs. os4, not shown).
For os3 vs. os4, 50N-90N average:
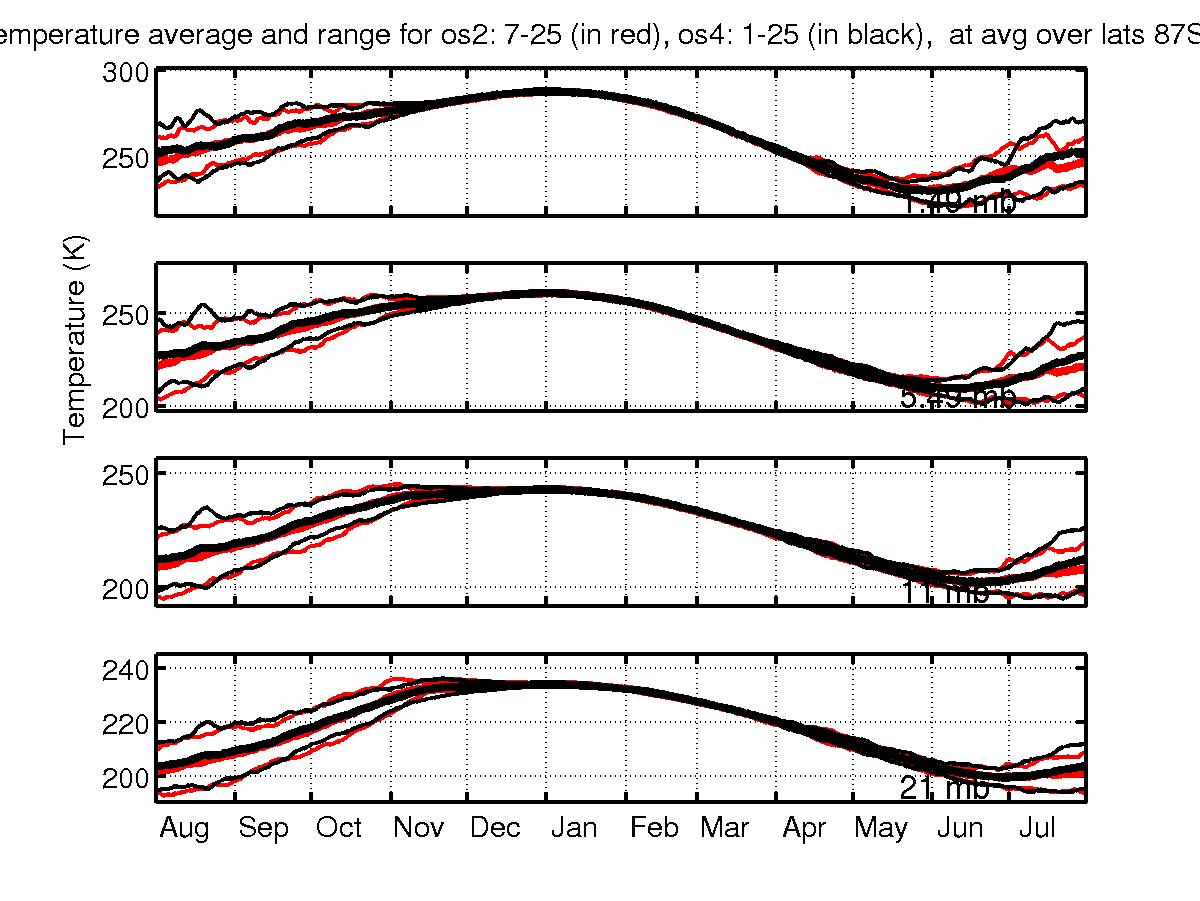
And the same thing again but for os2 vs. os4; no difference in the summer
means appears: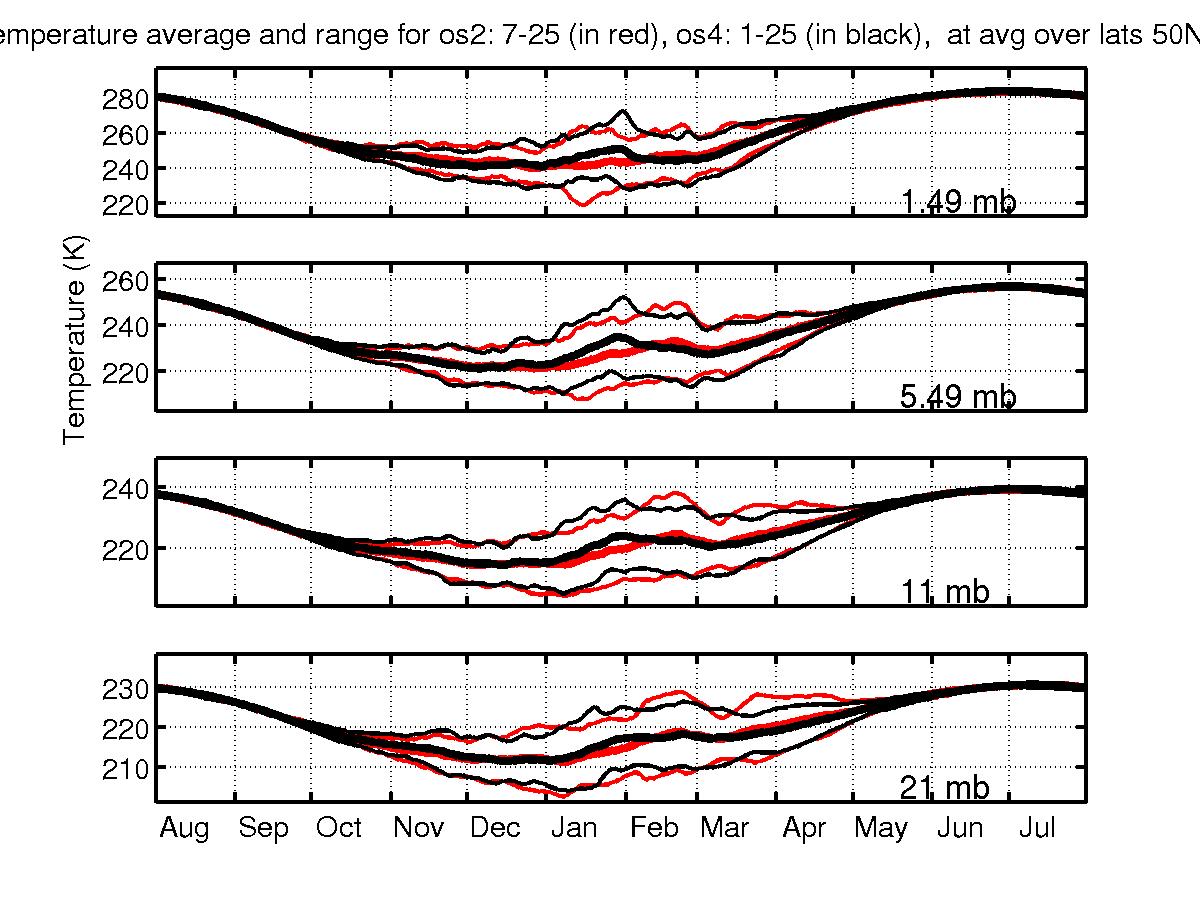
And then the same comparison again, but for the SH (so, 50S-90S average).
First, os3 vs. os4:
(oops - the altitudes are a bit hard to read in the SH plots. But they're
the same ones as above: 1.49mb, 5.49mb, 11mb, 21mb)

And then os2 vs. os4: