Previous: Introduction Next: Brewer Dobson circulation Up: Ext. Abst.
Trends in temperatures and planetary wave propagation
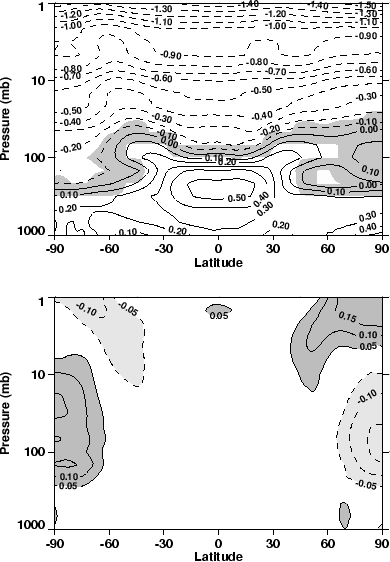
Both runs predict a systematic global cooling of the stratosphere, which increases with height and is broadly consistent with past observed trends, though in the upper stratosphere the past trends are slightly larger. In polar regions trends were unpredictable. This was due to internal decadal variability resulting from unpredictable decadal variations in the Rossby wave flux from the troposphere which, nonetheless, systematically increased over the 60 years in both runs [See Figs. 1 and 2 which are taken from Butchart et al. (2000)].
Fig. 1. Trends (K/decade) in the zonally averaged annual mean temperatures over the 60 years of run A. Shading indicates were the trends are not significant at the 95% confidence level. The lower panel shows the trend in run B minus the trend in run A and indicates the unreliability of quantitative predictions of temperature trends in the high latitudes in this model.
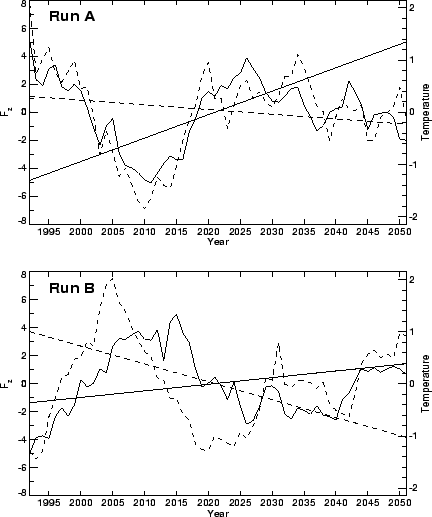
Fig. 2. Comparison between 10 hPa temperatures and the vertical
component of the EP flux (![]() ) at 100 hPa for the northern winter (DJF). The curves are deviations
from the 60 year mean with the linear trend (the straight lines)
removed and further smoothed by an 11-year running mean. Dashed
lines are the temperatures (K) averaged poleward of 60
) at 100 hPa for the northern winter (DJF). The curves are deviations
from the 60 year mean with the linear trend (the straight lines)
removed and further smoothed by an 11-year running mean. Dashed
lines are the temperatures (K) averaged poleward of 60![]() N and the solid lines
N and the solid lines ![]() (
(![]() Kg s
Kg s![]() ) averaged poleward of 40
) averaged poleward of 40![]() N. Similar conclusions can be inferred from the results for the
southern winter.
N. Similar conclusions can be inferred from the results for the
southern winter.
The systematic increase over the 60 years in ![]() seen in Fig. 2 is part of a more general increase in the flux
of wave activity from the troposphere which occurs in every seasons
and in both hemispheres (see Fig. 3). The largest changes tend
to be in the lower to middle latidues. Despite the increase in
the amplitude of the EP flux vectors the model results show little
evidence of any significant change in the wave focusing (i.e.
the direction of the flux vectors) in the sub-tropical lower stratosphere,
as has been found in the analysis of ``doubled CO
seen in Fig. 2 is part of a more general increase in the flux
of wave activity from the troposphere which occurs in every seasons
and in both hemispheres (see Fig. 3). The largest changes tend
to be in the lower to middle latidues. Despite the increase in
the amplitude of the EP flux vectors the model results show little
evidence of any significant change in the wave focusing (i.e.
the direction of the flux vectors) in the sub-tropical lower stratosphere,
as has been found in the analysis of ``doubled CO![]() '' experiments (Rind et al. 1998).
'' experiments (Rind et al. 1998).
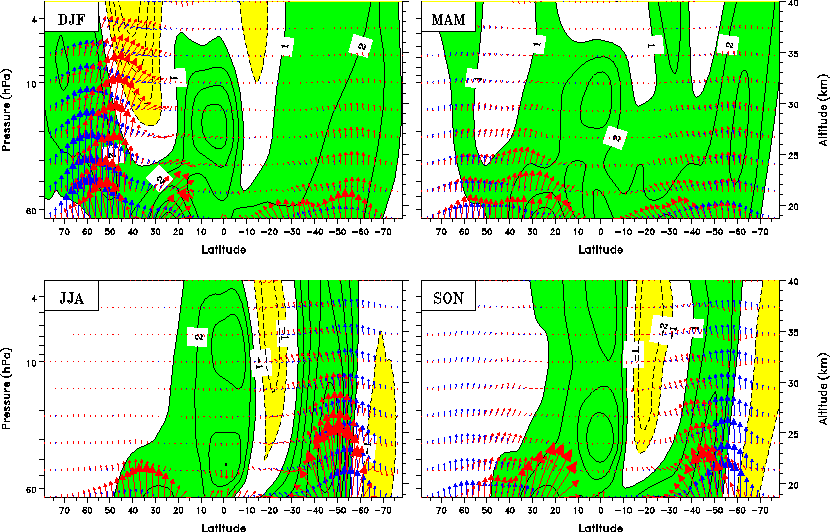
Fig. 3. Seasonal mean EP flux at the start of run B (blue arrows)
and the change (![]() ) over the 60 years (red arrows). The flux vectors have been multiplied
by the cosine of latitude to give the natural form for plotting
in the latitude-height plane (Dunkerton et al. 1981) and have been further scaled such that the distance occupied
by 10
) over the 60 years (red arrows). The flux vectors have been multiplied
by the cosine of latitude to give the natural form for plotting
in the latitude-height plane (Dunkerton et al. 1981) and have been further scaled such that the distance occupied
by 10![]() of latitude represents a value of
of latitude represents a value of
![]() Kgs
Kgs![]() and that occupied by 10 km in altitude represents a value of
and that occupied by 10 km in altitude represents a value of
![]() Kgs
Kgs![]() . Also shown is the change in the zonal mean zonal wind in ms
. Also shown is the change in the zonal mean zonal wind in ms![]() . Green shading denotes a westerly shift and, yellow, an easterly
shift. Results shown here were taken from a least squares linear
fit to the yearly data. A broadly similar picture is given by
the results of run A.
. Green shading denotes a westerly shift and, yellow, an easterly
shift. Results shown here were taken from a least squares linear
fit to the yearly data. A broadly similar picture is given by
the results of run A.