List of peer-reviewed publications
The Facility Level and Area Methane Emissions inventory for the Greater Toronto Area (FLAME-GTA)
Nasrin Mostafavi Pak, Sajjan Heerah, Junhua Zhang, Elton Chan, Doug Worthy, Felix Vogel, Debra Wunch
https://doi.org/10.1016/j.atmosenv.2021.118319
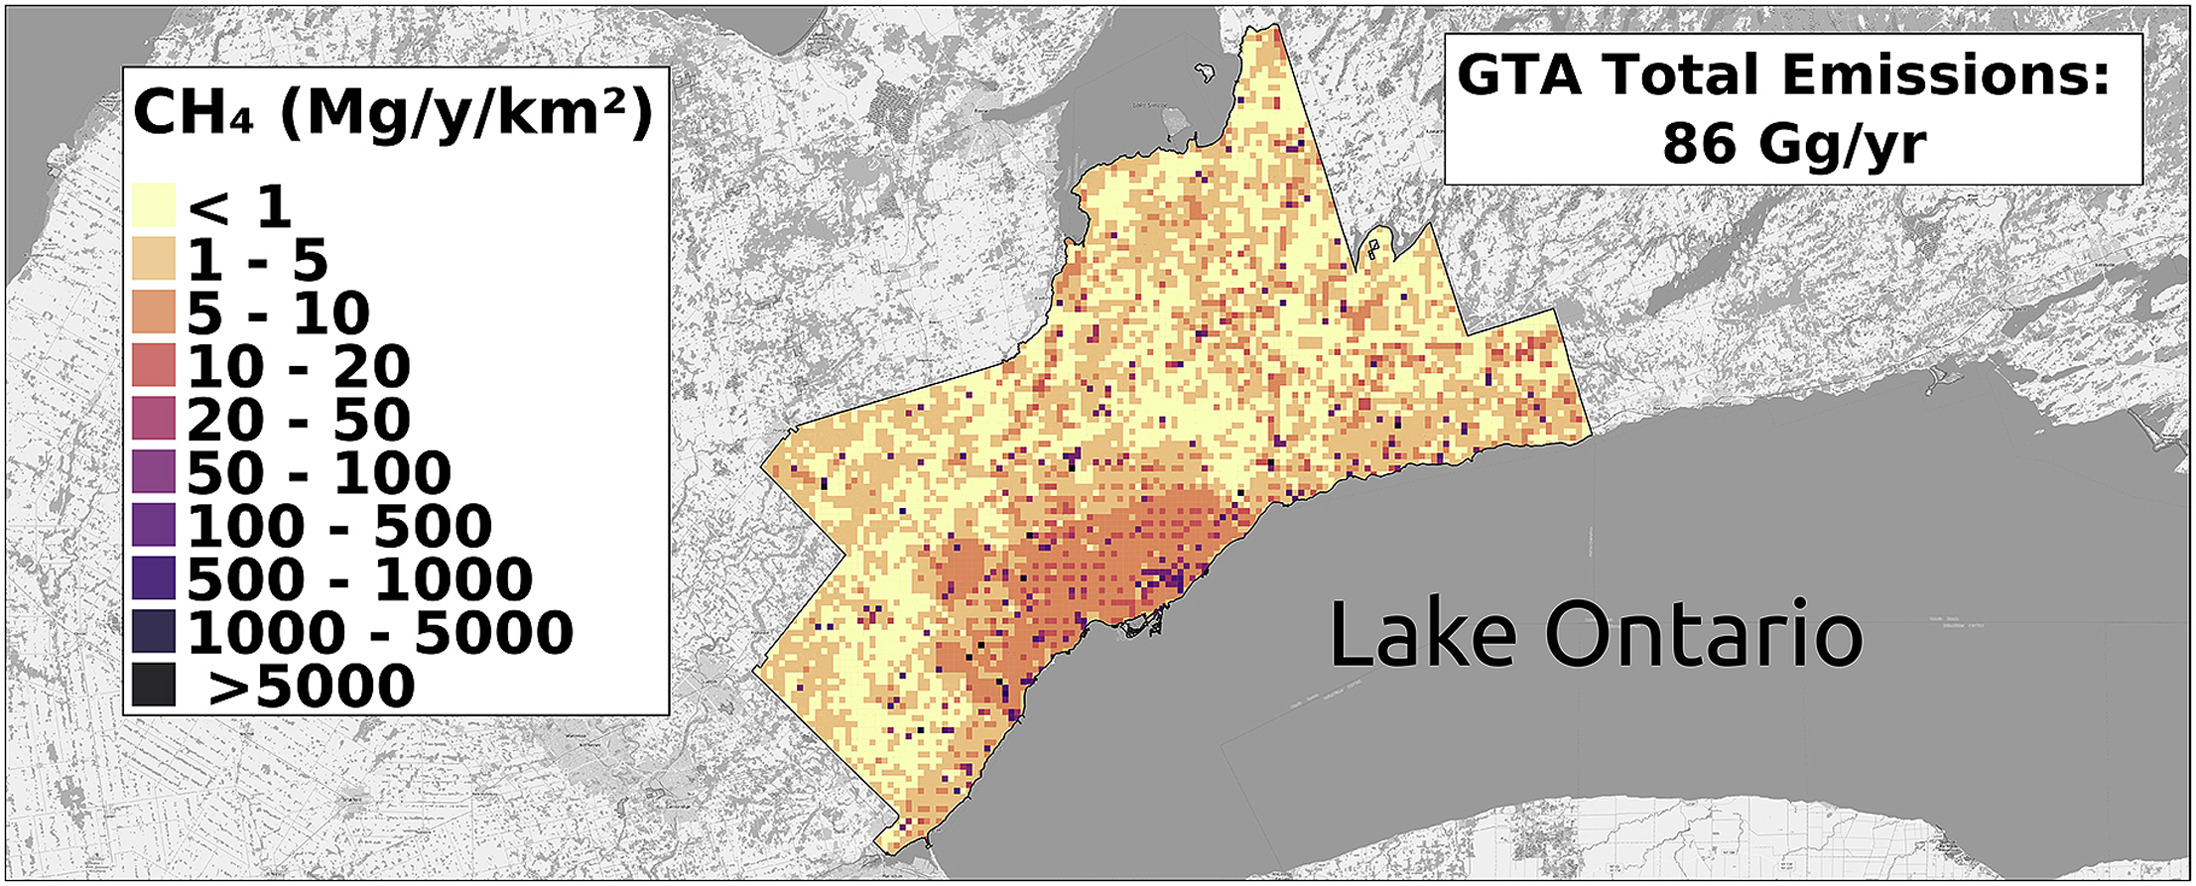
We present the Facility Level and Area Methane (CH4) Emissions inventory for the Greater Toronto Area (FLAME-GTA). We estimate that total emissions of CH4 in the GTA, the most populous metropolitan area in Canada, are about 86 ± 38 Gg/yr. The FLAME-GTA estimate is within uncertainty of, but lower in magnitude than the existing gridded inventories provided by the Emissions Database for Global Atmospheric Research (EDGAR v5.0), and by Environment and Climate Change Canada's Air Quality Research Division (ECCC - AQRD) that estimate emissions of 96 ± 48 Gg/yr and 143 ± 71 Gg/yr in the GTA region, respectively. Using a Lagrangian transport model, we predict atmospheric mixing ratios based on different emission inventories and compare the predictions with in situ measurements available from an observatory within the GTA for January-March in both 2015 and 2016. Due to the strong influence of local sources on our observations only a subregion of our GTA inventory is evaluated. These results identify the need for a more extensive measurement network and an improved atmospheric transport modeling effort for further evaluation of the emission inventories.
Investigation of the Spatial Distribution of Methane Sources in the Greater Toronto Area Using Mobile Gas Monitoring Systems
Sebastien Ars, Felix Vogel, Colin Arrowsmith, Sajjan Heerah, Emily Knuckey, Juliette Lavoie, Christopher Lee, Nasrin Mostafavi Pak, Jaden L. Phillips, and Debra Wunch
https://doi.org/10.1021/acs.est.0c05386
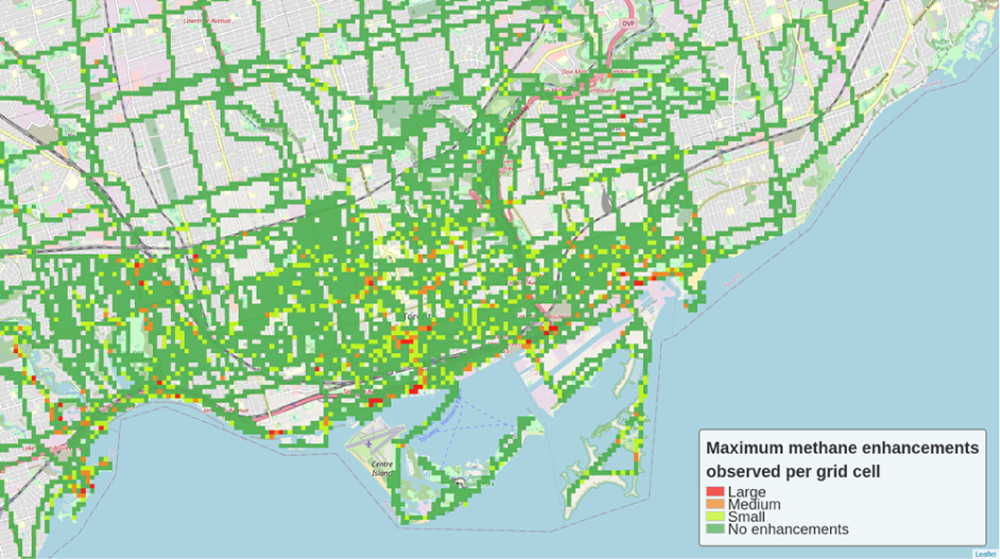
For methane emission reduction strategies in urban areas to be effective, large emitters must be identified. Recent studies in U.S. cities have highlighted the contribution of methane emissions from natural gas distribution networks and end use. We present a methane emission source identification and quantification method for the Greater Toronto Area (GTA), the largest metropolitan area in Canada, using mobile gas monitoring systems. From May 2018 to August 2019, we collected 77 surveys of methane mixing ratios covering a distance of about 6400 km, and sampled emission plumes from sources such as closed landfills, natural gas compressor stations, and waterways. Our results indicate that inactive landfills emit less than inventory estimates. Despite this discrepancy, we confirm that the waste sector is the largest methane emitter in the GTA. We also report that the frequency of methane leaks from the local distribution system ranges between 4 and 22 leaks per 100 km of roadway in downtown Toronto, which is comparable to the range observed in U.S. cities, which have invested in modern natural gas distribution infrastructure. Last, we find that engineered waterways, whose emissions are currently not reported in inventories, may be a significant source of methane.