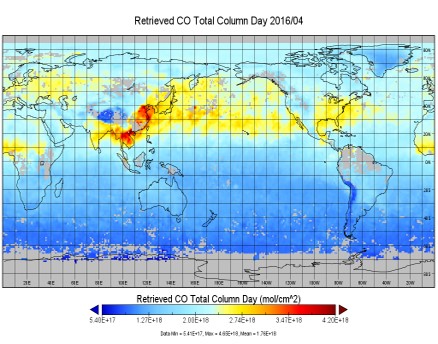
Trans-Pacific pollution transport
as seen by MOPITT
U of T
Summary
The CO transport over North Pacific
seems to be a known interesting phenomenon.
The source is
The transport is happening in spring
(March & April) each year. MOPITT was able to observe 17 such events. The
strongest events seem to be in years: 2003,2005, 2007 and 2008.
The pathways of CO transport is most
likely along the border between Aleutian Low and Pacific High, a quasi permanent
cyclonic-anti-cyclonic structure.
Direction of wind as well as the time to
cross the ocean confirm what we can observe with MOPITT (daily plots of CO tot
col.). So, a typical spring event of CO transport in North Pacific takes around
a little bit more than one week to cross the Pacific.
Using a larger time window (monthly
instead of daily) for averages it is easy to observe that the spring CO
transport band is interrupted around longitude 250 at the location of the
Rockies Mountains which ply a role of ‘pollution barrier’.
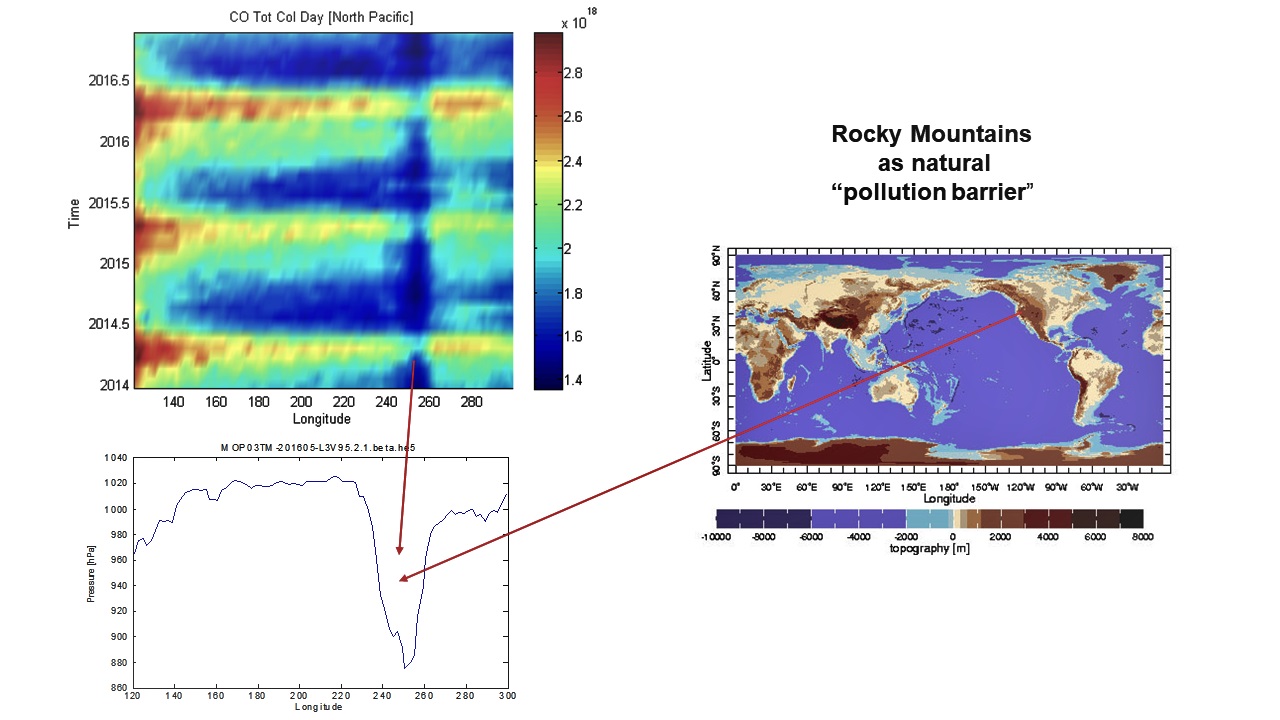
In the lower troposphere (mainly at
900hPa) during the spring, the CO transport band indicate an accumulation of CO just in
front of Rockies Mountains which probably can be explained as a reflection
(shock) of the pollution stream at the contact (collision) with the natural
barrier. This remark concerning ‘accumulation
of CO just in front of Rockies Mountains’ seems to be new, unseen
before.
The transport of CO over the
The CO accumulation just over the
As an example, the last CO transport
event (2016) has an unpretentious beginning in Nov-Dec previous year (2015) and
continue to intensify as the CO source on the West of Pacific is increasing the
emissions and culminating in March with a strong plume high in altitude and
moving toward the North American coast. For two months, the CO transport
continue at high altitude (~ 450 hPa) and then for the rest of the time (up to
Dec 2016) CO transport disappear along with the intensity decreasing of the CO
source on the West coast. The CO accumulation around the
For
eddy, hydraulic jump or Coanda effect we can refer to
Kraig Winters (Scripps, UCSD) [http://scrippsscholars.ucsd.edu/kbwinters/]
and to his model-simulation which is very similar to what we can observe in CO
transport toward
https://www.youtube.com/watch?v=30QbqsYW6gQ&list=PLwVjxV0j7EdccdffOxq0ZGGCLrHjWrnKr&index=2
References
W.R. Peltier and J.F. Scinocca,
The Origin of Severe Downslope Windstorm Pulsations, J. Atmos. Sci., 47,
2853-2870, 1990
Hongbin Yu,
et al; A Satellite-based Assessment of Trans-Pacific Transport of Pollution
Aerosol.
Submitted to the Journal of
Geophysical Research -Atmospheres, September
2007,Yoram J. Kaufman Symposium on
Aerosols, Clouds, and Climate;
Special Issue of the Journal of
Geophysical Research
- Atmospheres
J. Nam
et al; Trans-Pacific
transport of Asian dust and CO: accumulation of
biomass burning CO in the subtropics and dipole structure of transport, Atmos. Chem. Phys., 10, 3297–3308, 2010
(and
acp-10-3297-2010-supplement.pdf)
Ja-Ho Koo
et al; Springtime trans-Pacific transport of Asian pollutants
characterized by the Western Pacific (WP) pattern.
Atmospheric Environment · December 2016
DOI: 10.1016/j.atmosenv.2016.10.007
(Supplementary data related to
this article can be found at
http://dx.doi.org/10.1016/j.atmosenv.2016.10.007.)
An interesting
movie which illustrate the CO
transport over Pacific Ocean with its many
exciting features can be seen at:
(author J Drummond, presentation at
the IWGGMS meeting
2017 )
https://youtu.be/e3eahY40Mj4