CO Trends
(global & at Maula Loa)
An important fact which is often analysed is the trend of CO pollution.
MOPITT with its almost 20 years of CO observations can give a valuable
anwser.
(see for example a recent MOPITT-paper concerning this problem:
Decadal record of
satellite carbon monoxide observations
H. M. Worden et al,Atmos. Chem. Phys., 13, 837–850, 2013 )
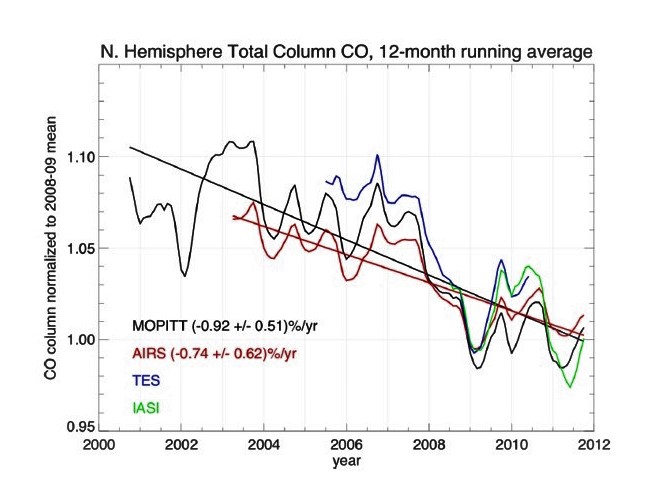
The CO trends over diverse regions show similar decreasing tendency.
The 12-month running
averages for N. Hemisphere total column CO shows a remarkable agreement between
MOPITT,AIRS TESS and IASU observations
(In order to correct
compare data from different instruments, the CO
measurements are normalized by the 08/2008–07/2009 average CO column for each
instrument).
Another interesting observation done with MOPITT and confirmed by other instruments is the fact that CO variations over the glob seems to be somehow correlated.
After removing the seasonal variations (using 12 months running average) and NS asymmetry (by observing CO relative to the total average of CO of the latitudinal band), the CO Tot Col as measured by MOPITT (V5 TIR day) shows interesting variations of the trends with:
-maxima around 2003, 2005 and 2007 & - deep decrease in 2009 (and still low in 2011)
These variations relative to the zonal average, are almost of the same magnitude at all latitudinal bands and this seems to be not a trivial fact.
The MOPITT observations (deep decrease in 2009 and after) are confirmed by AIRS and TES instruments as well as by the NOAA observations

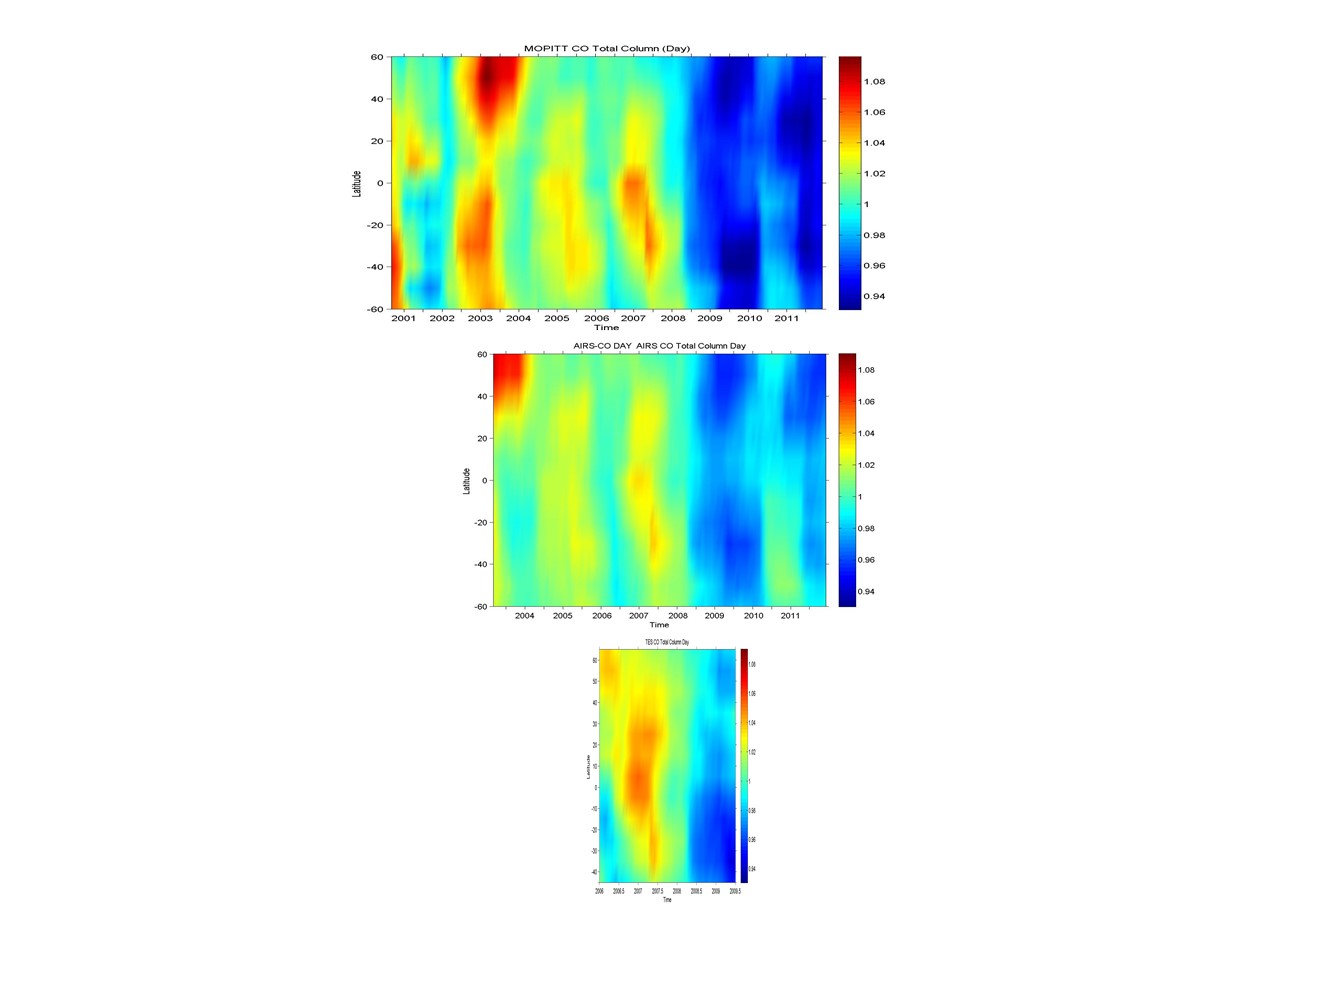
The color plot of the ratio of seasonal removed CO total Column, to the CO
total Column -Latitudinal Average for MOPITT, AIRS and TES.
For MOPITT and AIRS only comparison see H. M. Worden, et al.Decadal record of satellite carbon monoxide observations.
Atmos. Chem. Phys., 13, 837-850, 2013
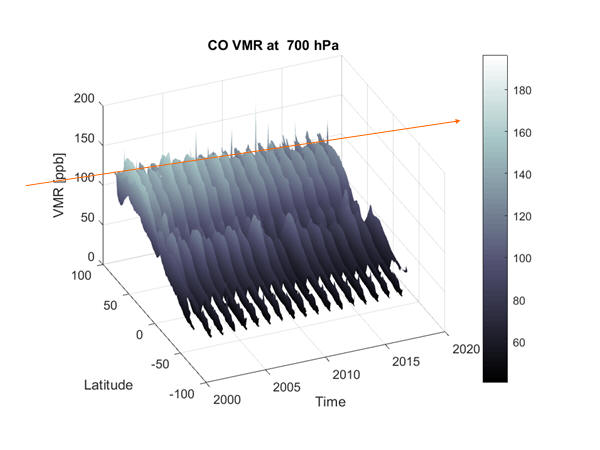
The CO decreasing trend seems to be a general tendency even at different altitudes.