Summary
Key findings
Instrumentation, precision and accuracy
Tropospheric and stratospheric water vapour has been measured over the past 50 years by a large number of individuals and institutions using a variety of in situ and remote sensing measurement techniques. Measurement results are widely dispersed in the literature. Instrumentation has steadily evolved from a small number of manually operated in situ instruments to automatic devices deployed on balloon and aircraft platforms, and more recently to high precision sensors on satellites. Only a limited number of measurements of relative or specific humidity using a single instrument type have records longer than 10 years.
Operating principles and measurement specifications of most in situ research-type instruments currently in use are presented in Table 1 along with their estimated measurement accuracy. These instruments provide point measurements in time and space with high vertical resolution, typically in the range of a few hundred meters or better. Accuracy estimates range from 5 to 10% based on known or estimated random and systematic uncertainties inherent in the instrument system, calibration procedures and retrieval algorithms. Remote sensing instruments deployed on ground-based, balloon-borne and airborne platforms provide vertical profile measurements with stated accuracy similar to in situ instruments, although with coarser vertical resolution. Such vertical resolutions range from several hundred meters in the case of LIDAR, to a few kilometres for the infrared (IR) and far infrared (FIR) spectrometers, and approximately 10km for microwave instruments.
Table 1. In situ and remote sensing techniques for measurements of H2O from ground-based, balloon-borne and airborne platforms, along with their typical measurement range and overall accuracy, i.e. the sum of systematic and random errors. For details, see Table 1.29 and text in Section 1.2 and 1.3.
|
|
|
|
|
|
|
|
|
|
|
|
|
|
|
|
|
|
|
|
|
|
|
|
|
|
|
|
|
|
|
|
|
|
|
|
|
|
|
|
|
|
|
|
|
Satellite and shuttle-based experiments for measuring stratospheric and upper tropospheric water vapour are listed in Table 2 along with random and systematic error estimates for single profile observations (as opposed to zonal or temporal averages). Accuracy estimates can be obtained from the root-sum-square of the random and systematic error components. Error estimates are given for ranges of vertical levels. Since some systematic error components vary randomly from profile to profile, these components are less important for daily, seasonal, or zonal means. Therefore, a zonal-average stratospheric error profile is dominated by the truly systematic error components, whose signs may be unknown and offsetting. The vertical resolution of satellite instruments, also given in Table 2, depends on the individual measurement concept (e.g. occultation or emission) and the specific instrument implementation. Horizontal resolution is typically on the order of 50 km to 300 km depending on whether the experiment is nadir or limb viewing.
Table 2. Estimates of random errors, systematic errors and vertical resolution of stratospheric H2O profiles derived from satellite instrumentation.
|
|
|
|
Vert. Res. (km) |
|
LIMS (version 5) (Limb IR emission) |
20-15% (1 - 5 hPa) 15-10% (5 - 10 hPa) 10% (10 - 50 hPa) |
31-24% (1 - 5 hPa) 24-20% (5 - 10 hPa) 20-37% (10 - 50 hPa) |
|
|
SAGE II (version 5.9) (IR solar occultation) |
10-5% (3 - 10 hPa) 5-14% (10 - 25 hPa) 14% (25 - 300 hPa) |
6-13% (3 - 7 hPa) 13% (7 - 25 hPa) 13-27% (25 - 100 hPa) 27% (100 - 300 hPa) |
|
|
ATMOS (version 3) (IR solar occultation) |
|
|
|
|
HALOE (version 19) (IR solar occultation) |
9-7% (1 - 10 hPa) 7-13% (10 - 40 hPa) 13% (40 - 100 hPa) |
10-14% (1 - 10 hPa) 14-19% (10 - 40 hPa) 19-24% (40 - 100 hPa) |
|
|
MLS (version 0104) (Limb m wave emission) |
4% (1 - 10 hPa) 3% (10 - 50 hPa) 3-8% (50 ? 100 hPa) |
6-9% (1 - 10 hPa) 9-16% (10 - 50 hPa) 16-50% (50 ? 100 hPa) |
|
|
MAS (Limb m wave emission) |
|
|
|
|
ILAS (version 4.20) (IR Solar occultation) |
More than 10% above 2 hPa) 10-5% (2 - 300 hPa) |
30% (1 - 2 hPa) 30-10% (2 - 7 hPa) 10% (7 - 300 hPa |
|
|
POAM III (version 2) (IR Solar occultation) |
|
|
|
The Microwave Limb Sounder (MLS) and several generations of High Resolution Infrared Sounder (HIRS) instruments on the TIROS Operational Vertical Sounder (TOVS) suite of missions have provided measurements of upper tropospheric relative humidity from satellites. MLS relative humidity accuracy estimates for low to mid-latitudes range from 10 to 35% at 147 hPa and 20 to 50% at higher pressures. Accuracy estimates for individual relative humidity measurements made by TOVS are difficult to obtain but several generations of TOVS instruments span a temporal range of more than 20 years opening up the possibility of evaluating long-term changes. An issue for the use of TOVS is the availability of coincident accurate in situ profile data from one to the next generation of TOVS instruments to provide calibration across multiple spacecraft.
The data sets used in this assessment are available for independent verification of the results and conclusions of this Report at the SPARC Data Center (http://www.sparc.sunysb.edu) where they will also be preserved for future studies.
Data quality assessment
Stratosphere
Over 25 instruments representing several techniques were assessed for the quality of the data that they produce. For both the stratosphere and the troposphere there is no single technique or instrument platform that is recognised as a standard to which other techniques should be compared, and thus comparisons were made relative to one another.
The Halogen Occultation Experiment (HALOE) measurements on the Upper Atmosphere Research Satellite were selected as baseline data for stratospheric comparisons in this assessment. This was not meant to imply that HALOE is considered a standard, but rather that its spatial and temporal coverage allowed a maximum number of coincidences with other instruments. The layer between 60 and 100 hPa contains the best overlap of satellite, balloon-borne and aircraft measurements. Layers higher in the stratosphere, 10-50 hPa, and 1-10 hPa are also considered, but include only balloon-borne, satellite and ground-based microwave comparisons.
On average, measurements from the various instruments agree to within their stated levels of accuracy throughout the stratosphere. The mean of all the measurements compared was ~5% higher than HALOE, with a clustering of most of the instruments within a 10% range.
The differences between the stratospheric measurements are summarised in Figure 1 for three pressure layers previously mentioned. The mean differences are plotted as symbols and the bars represent differences estimated from indirect comparisons using one instrument as a transfer standard to compare with a second. A reasonable degree of consistency was found among measurements made from near the tropopause up to 50 km (~1 hPa). The majority of the instruments clustered within a 10% range, although direct comparisons among individual instruments showed larger differences sometimes exceeding 30%. Indirect intercomparisons show as much as 50% differences in some cases. Reasons for the differences were not revealed in this assessment process, although atmospheric variability is likely an important factor.
Upper troposphere
The worldwide radiosonde network has provided tropospheric humidity measurements since the 1940's but sensor performance tends to be of poor quality at the cold temperatures and low pressures present in the upper troposphere. Comparisons between the widely used radiosonde Vaisala Humicap A sensor and the CMDL frostpoint instrument show, for example, that at temperatures of -60°C the reported humidity from the radiosonde is only one half of the frostpoint instrument value. Additionally there have been numerous changes in radiosonde instrumentation over the period of the existing data record further complicating analysis of such data for long-term changes. Consequently, comparisons with in situ measurements of UTH from operational radiosondes should not be used to validate satellite data in this region.
The focus of the upper troposphere data quality assessment was TOVS because it has the most extensive record length, and hence is the most suitable for examining long term changes in UTH. The tropospheric MLS sensor provided the best data set for comparison with TOVS, and only small biases were found between them. Comparisons between satellite and direct water vapour measurements from in situ observations did not provide strong constraints on the performance of the TOVS satellite sensors. This was due mainly to problems with the in situ methods, especially the radiosondes and also because of difficulties in making comparisons in an inhomogeneous atmosphere when instruments have very different spatial coverage and altitude resolution. The assessment of the TOVS data did not reveal any major inconsistencies in this data set that would preclude its use in describing the long-term behaviour of upper tropospheric humidity. Overall measurements from these two very different techniques, TOVS and MLS, appear to produce comparable results on monthly averaged time scales. However, it was found that high spatial and temporal variability in the upper troposphere introduces major difficulties in validating satellite measurements. Judicious use of data from the MOZAIC (Measurement of Ozone and Water Vapour by Airbus In-Service Aircraft) project provided some information used in assessing the quality of the MLS and TOVS measurements. To gauge their value in future correlative efforts, DIAL and Raman LIDAR systems were compared with radiosondes and frostpoint hygrometers. The LIDAR results in the troposphere agree to within about 10% with other correlative measurements, suggesting that such systems accurately measure water vapour. If deployed in sufficient numbers, such measurements could provide profile data valuable for validation of satellite measurements.
Figure 1 Summary of the relationship between stratospheric measurements assessed in this report for 3 altitude ranges. The symbols give the direct percentage difference from HALOE, and the horizontal lines show the range of the indirect comparisons. Each tick mark is 1%, and the placement for HALOE is indicated by the dotted line. Where no direct comparison was available, the symbols give the average of the indirect comparisons.
Spatial variability and seasonal changes
Stratosphere, including the tropopause
The annual zonal mean water vapour distribution in the stratosphere is depicted in Figure 2. Key features are sharp vertical gradients at the tropopause and in the extratropical lower stratosphere, a minimum in the tropics at or just above the tropopause, and gradual increases upward and poleward. The water vapour distribution can be understood as a balance between dry air entering via the tropical tropopause, a source of water vapour from methane oxidation in the upper stratosphere and return to the troposphere via the extratropical tropopause. The general features of the distribution are explained by Lagrangian-mean transport via the Brewer-Dobson circulation, wave-induced isentropic mixing, and upward extension of tropospheric circulations in the lowest few kilometres of the stratosphere. Nearly all air that reaches the stratosphere above 100 hPa passes through the tropical tropopause where freeze drying at low temperatures and other poorly understood processes produce annual mean mixing ratios of ~3.5-4 ppmv. Some of this dry air rises slowly in the tropics, but most spreads poleward, primarily in the lowest few kilometres of the stratosphere. In addition, water vapour concentrations increase upward and away from the equator as methane is oxidised into water vapour. Below approximately 100 hPa, the extratropical lower stratosphere is moistened by air transported from the tropical upper troposphere horizontally across the subtropical tropopause at the location of the subtropical jet.
Figure 2 Annual zonal mean water vapour from HALOE and MLS data by height and equivalent latitude. Contour interval of 0.2 ppmv. The thick dashed line is the tropopause, and the thick solid line is the 400K potential temperature surface.
The horizontal transport in the lower stratosphere has a strong seasonal component (Figure 3). An absolute minimum of the mixing ratio (~2.8 ppmv) is centred near 20oN during January-March, with the dry air propagating both towards the North pole and into the Southern Hemisphere. Relatively high water vapour values, centred near 30°N, are observed during the Northern Hemisphere summer coincident with the convective phases of the summer monsoons. Similar to the winter poleward propagation of the dry air masses, the higher summer values also appear to spread out to the pole of the summer hemisphere and into the winter hemisphere. The horizontal transport caused by the South Asian monsoon is stronger than other monsoon circulations, leading to more water vapour in the upper troposphere during boreal as opposed to austral summer.
At the tropical tropopause, a complex mix of processes act to remove water vapour from air as it enters the stratosphere from the troposphere below. Within the framework of large-scale mean ascent, the dehydration processes probably include smaller-scale (convective) ascent, radiative and microphysical processes within clouds, and wave-driven fluctuations in temperature. The location, strength, and relative importance of these processes vary seasonally. However, the observed seasonal variation in tropopause-level water vapour is influenced primarily by the annual variation in tropical tropopause temperatures. Air rising through the tropopause is marked with seasonally varying mixing ratio, and retains these markings as it spreads rapidly poleward and more slowly upward into the stratosphere.
Figure 3 Latitude-time evolution of water vapour mixing ratio near 380 K derived from seasonal cycle fits of the HALOE data.
Upper troposphere
Upper tropospheric water vapour in the tropics and subtropics is strongly influenced by the Hadley Cell and the Walker Circulation. The predominant source for moisture in the tropical and subtropical upper troposphere is convection, producing, on average, moist regions in the convective areas over the western Pacific, South America and Africa (Figure 4). Moist areas also appear seasonally in the region of the Asian summer monsoon and along the intertropical and South Pacific convergence zones. The seasonality of surface temperature and of convection, which roughly follow the sun, as well as seasonal variations in monsoon circulation, produce concomitant seasonal changes in water vapour in the troposphere. This relationship between convection and upper tropospheric moisture changes sign near the tropical tropopause, somewhere between 150 hPa and 100 hPa, so that convection dries the tropopause region. Water vapour is also influenced by fluctuations at both shorter and longer time scales, including the quasi-biennial oscillation in the stratosphere and the El Niño-Southern Oscillation and the Tropical Intraseasonal Oscillation in the troposphere.
Upper tropospheric water vapour at middle and higher latitudes is highly variable and can be supplied by transport from the tropics, by mesoscale convection, or by extratropical cyclones. Dry air can be transported from the subtropics or from the extratropical lower stratosphere. These transport phenomena tend to be episodic rather than steady.
Figure 4 Annual mean Upper Tropospheric Humidity over ice (UTHi) averaged for 1980-1987 from HIRS instruments, in percent.
Long-term changes
Stratosphere
There is only one nearly continuous time series of stratospheric water vapour with a duration of 20 years, made using a single instrument type, and available for the determination of long-term change. Although differences between instrument systems were largely determined to fall within their stated uncertainty estimates, those differences are still too large to combine various instrument records to construct a longer time series. However, a number of data sets used in the assessment sampled the atmosphere periodically over a long period providing several time series of intermediate length (8-15 years). These were used in combination to estimate stratospheric changes. The observations are consistent in suggesting that water vapour has increased at a rate of about 1%/year over the past 45 years (Figure 5). The record also suggests that this increase has not been uniform but has varied over this period.
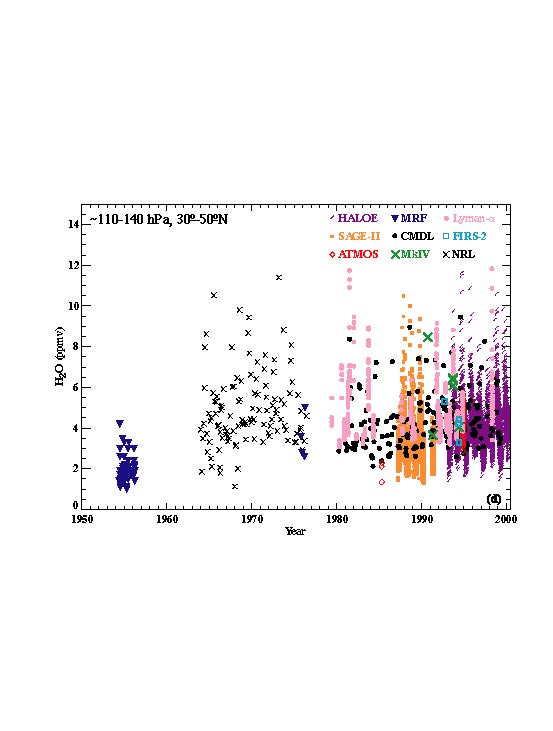
Figure 5 Time series of Water vapour measurements made by several instruments between 30-50oN over the pressure range 110-140 hPa. Data plotted are individual measurements with the exception of NOAA-AL Lyman-a (1 minute averages). Data below 100 hPa have been screened to omit tropospheric measurements.
Upper troposphere
The longest data set of upper tropospheric humidity is one that is derived from the HIRS instrumentation on different TOVS satellites. The HIRS instruments cover a time period of nearly twenty years. A linear fit of relative humidity from 1979 to present is shown in Figure 6. The trends for different latitudinal bands, and especially in the deep tropics, are slightly positive but insignificant at the 99% confidence level.
Figure 6 Annual mean upper tropospheric humidity over ice from HIRS for various latitude bands and linear fit statistics from 1980 to 1997: 60°S-60°N (solid line), 60°S-30°S (dotted line), 30°S-10°S (dashed line), 10°S-10°N (dot-dash line), 10°N-30°N (dash-3dots line) and 30°N-60°N (long dashed line).
A shorter time series of UTH, 1992 to present, has been obtained using the MLS instrument. Figure 7 shows the MLS humidity for centre altitudes of 147 and 215 hPa over the latitude range 30°S-30°N. For the overlapping time period both data sets show a minimum in relative humidity that occurs in 1994 although the MLS minimum is shallower.
When combined with satellite-derived upper tropospheric temperature data which also show a small positive trend since 1979, the HIRS data imply a larger positive specific humidity trend, but the combination of uncertainties in these two types of measurements means that the uncertainty in specific humidity is large enough to hide trends that are significant to climate.
Figure 7 MLS relative humidity over ice. Data were averaged between 30°S and 30°N. The figure on the left represents a 3 km layer around 147 hPa and that on the right a 3 km layer around 215 hPa. Dots are daily averages and the line is a 12-month running mean boxcar filter to remove the annual cycle.
Recommendations