|
|
|
|
|
|
|
|
1) KNMI, PO-Box 201, NL-3730 AE, De Bilt, The Netherlands
2) TNO-FEL, PO-Box 96864, NL-2597 AK,The Hague, The Netherlands
FIGURES
Abstract
|
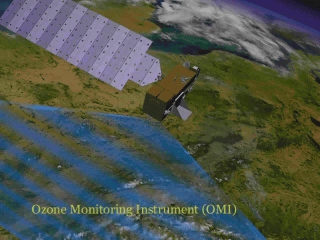
Introduction The Ozone Monitoring Instrument (OMI) is the Dutch-Finnish contribution to the NASA EOS-AURA mission, which is scheduled for launch in June 2003. OMI is an imaging spectrometer that measures in the spectral range between 270 and 500 nm. OMI combines a relatively high spatial resolution (13x24 km? at nadir) with daily global coverage. From the radiance spectra measured by OMI, total columns of gases like ozone, NO2, BrO and SO2 will be derived. Also, cloud and aerosol parameters will be determined from the OMI measurements. |
|
|
Ozone Monitoring Instrument OMI is an imaging spectrometer that uses two-dimensional CCDs for simultaneous spatial and spectral registration. It measures in the spectral range between 270 and 500 nm, with a spectral resolution of approximately 0.5 nm. The spectral sampling varies from 0.15 to 0.32 nm. The swath width of OMI is 2600 km, which provides daily global coverage, see Figure A. To obtain this large swath, the viewing zenith angle at the end of the swath is 57°. Figure A. The coverage of the OMI. At the equator the OMI provides daily global coverage, whereas at higher latitudes more two or more overpasses per day will be available. |
|
|
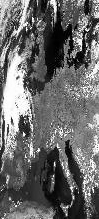
In the normal operation mode, the OMI pixel size is 13x24 km? at nadir (along x across track), however in the zoom mode the spatial resolution can be reduced to 13x12 km? . An impression of the spatial resolution of OMI is given in Figure B. Due to the small ground pixel size, OMI can look ``in between the clouds'', thus being able to obtain tropospheric information on ozone, NO2 and aerosols. Figure B. AVHRR channel 2 image over Europe resampled to a grid of approximately 13x40 km? , to give an impression of the spatial resolution of OMI. |
|
|
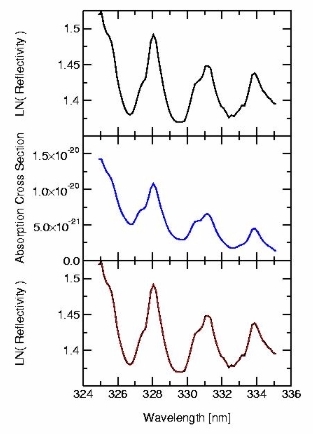
OMI data products Absorption cross sections of gases often show distinct spectral features. Differential Optical Absorption Spectroscopy (DOAS) uses these spectral features to derive the gas column density. The DOAS method is illustrated in Figure C. In the OMI spectral range, ozone, NO2, BrO, SO2, OClO and HCHO, can be detected using the DOAS technique. In addition to the ozone total column density, also an ozone profile with a vertical resolution of approximately 5 km will be determined from the OMI data. The height information is derived from the rapid increase of the ozone absorption cross section towards the shorter wavelengths in the UV. Figure C. The upper panel shows a simulated reflectivity spectrum. The middle panel shows the ozone absorption cross section (in cm?/molec.) on OMI spectral resolution. In the DOAS method the logarithm of the reflectivity (upper panel) is fitted by a linear combination of the absorption cross section (middle panel) and a polynomial. The fitted spectrum is shown in red in the lower panel, along with the simulated spectrum (in black). |
|
|
Besides the concentration of gases, OMI will also derive information
on clouds and aerosols. The OMI cloud information includes both
the cloud coverage and the cloud top pressure. The cloud parameters
can be used for climate studies, and are important for the retrieval
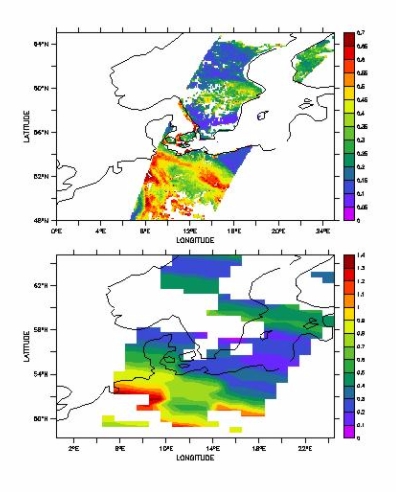
of other OMI products. Figure D. Comparison between aerosol optical depth at 555 nm derived from ATSR-2 data, and aerosol optical depth at 400 nm derived from GOME data. OMI will use a retrieval technique based on GOME experience (lower panel), but on a resolution comparable to the upper panel, and with daily global coverage. |
|
|
Conclusion The OMI instrument, that will fly on-board the NASA EOS-AURA mission between 2003 and 2008, will make an important contribution to atmospheric chemistry research and climate monitoring. OMI will measure total columns of ozone, NO2, SO2, BrO, HCHO, OClO, as well as aerosol and cloud parameters . In addition to the ozone column, also the ozone profile will be measured. Because of the high spatial resolution combined with daily global coverage, OMI will provide new challenging information on the chemistry of the lower troposphere. The OMI retrieval algorithms are developed in the 2000-2001 time frame. The Dutch OMI science team welcomes suggestions and contributions by the OMI user community. |
Back to
| Session 1 : Stratospheric Processes and their Role in Climate | Session 2 : Stratospheric Indicators of Climate Change |
| Session 3 : Modelling and Diagnosis of Stratospheric Effects on Climate | Session 4 : UV Observations and Modelling |
| AuthorData | |
| Home Page | |