Previous: Measurements and UV-B modeling Next: Conclusions Up: Ext. Abst.
Results and discussion
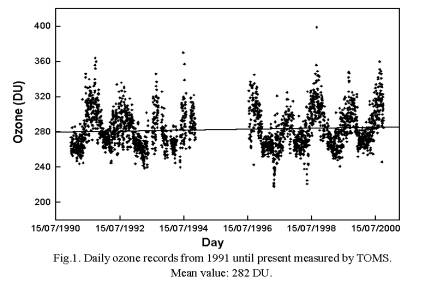
In fig. 1, the daily total column ozone content between 1991 and 2000 over Córdoba city is shown as measured by TOMS (Total Ozone Mapping Spectrometer). The straight line is the best-fit linear trend. The mean value for the last 10 years is 282 Dobson Units (DU). The minimum values are usually recorded between April and May and the maximum ones between August and October.
Figure 2 shows the diurnal variation of the solar UV-B irradiance as measured by the UVB-1 broadband radiometer operating at the campus of the University for a day with no clouds, no aerosol and no pollution. The rain of the previous night ensured these conditions. The model calculation results can also be seen as well as a very good agreement with the experimental measurements.
The annual course of UV-B in Córdoba for 1999 and 2000 is shown in fig. 3, where we plot UV-B irradiance at solar noon for all the days that we could carry out the measurements. Full diamonds represent a radiative model solution assuming clear skies, no aerosols, no clouds and TOMS values from 1999 until present. The empty diamonds represent the experimental measurements which were carried out under diverse meteorological conditions. It can be observed that different levels of air pollution, aerosol and/or clouds result in a significant reduction of the solar irradiance reaching the ground.
The effect of aerosols on UV-B radiation for a cloudless day (20/08/1999) is shown in fig. 4. In this case, the reduction of UV-B radiation, compared with model calculations, ranges from 30 up to 40% depending on the solar zenith angle. This is a usual situation in Córdoba during wintertime when rain is nearly absent and consequently there is not removal of aerosols by wet precipitation [4]. Because of this the aerosol loading increases until wet precipitation clears up the atmosphere. This effect can be seen in fig. 5 which shows the measured/modeled ratio for cloudless days from November 1998 until present.
Unfortunately, aerosols in Córdoba city have not been characterized yet, making it very difficult to draw more than qualitative conclusions. However, preliminary analysis of direct and diffuse UV-B radiation of five consecutive days with high aerosol load demonstrated that in these days there was an important decrease in the direct radiation without an increase in the diffuse one. One possible explanation would be that the aerosols present in wintertime are more efficient in absorbing than scattering UV-B radiation.
The effect of clouds on UV-B radiation can be as varied as the clouds themselves because it depends on many factors such as cloud type, thickness, droplet number density, zenith angle, etc. In addition, cloud condition usually changes considerably in a short time making it very difficult to analyze and predict its effects. Thus and in order to capture the rapid variation in the irradiance, a frequent sampling is necessary. For this reason, readings are taken every 2 seconds and averaged and stored over 30-sec intervals. Figure 6 shows the cloud effects on either UV-B and total radiation.
In this figure different effects can be seen. One of them is the decrease of intensity and the other one is the increase of intensity with reference to cloudless conditions. The decrease is the most common one and it can be as large as 70 % for days heavily cloudy. The increase, called broken cloud effect, is produced on partially cloudy days when the direct sunlight is present and the diffuse one is increased by scattering on the sides of white clouds.