
Previous: Parameters Values Next: Conclusions Up: Ext. Abst.
Results
The model sensitivity of the ozone profile changes (see Fig. 3) is not so high in general. Tropospheric increase of ozone results in rather positive effect about 2-4% of solar heating in troposphere and about 2% negative in stratosphere (see Fig. 4, Fig. 5). Stratospheric ozone reduction means strong influence on solar heating in stratosphere (about 25% negative) and up to 5% of positive effect in troposphere (see Fig. 6, Fig. 7). The effect of real ozone profiles or monthly mean profiles (Fig. 8, Fig. 9) is rather little. For June 1994 it can be seen in Fig. 10, Fig. 11 or Fig. 12, Fig. 13, respectively. But, there are some locations on some days where this small direct effects probably due to changes in stability can change cloud formation (see Fig. 14, Fig. 15, Fig. 16, Fig. 17, respectively, for individual experiments), and thus greater impact not only in solar heating but in long wave radiation and other parameters can be seen under these circumstances. The complete series of the first one is presented in Fig. 18, Fig. 19, Fig. 20, Fig. 21 as the differences for individiual experiments against control run, relative differences in Fig. 22, Fig. 23, Fig. 24, Fig. 25, respectively, with a sample of detail in Fig. 26. For comparison with IPCC figures some other heating parameters are presented in terms of monthly means for whole model domain. For all individual June 1994 experiments solar flux absorbed at the surface is displayed in Fig. 27, Fig. 28, Fig. 29 and Fig. 30. Further, for tropospheric and stratospheric sensitivity tests we present long wave cooling of the surface (Fig. 31, Fig. 32, respectively), solar flux absorbed in whole column of the atmosphere (Fig. 33, Fig. 34, respectively), net up flux at the top of the atmosphere (Fig. 35, Fig. 36), cloudness (Fig. 37, Fig. 38) and for surface air temperature all individual experiments, i.e. Fig. 39, Fig. 40, Fig. 41 and Fig. 42, respectively. We have also made some preliminary test of the ozone influence for the months with ozone extremes, we selected episodes from March 1994 as a month with high ozone values and variability (see Fig. 43), October 1994 was chosen as a month of low ozone value (see Fig. 44). We present solar heating and long wave cooling relative biases in Fig. 45 and Fig. 46, respectively, and mean departures of solar flux absorbed at the surface and long wave cooling at the surface in Fig. 47 and Fig. 48 for March 1994. Similarly, Fig. 49, Fig.50, Fig. 51 and Fig. 52 display the same parameters of the model simulation for October 1994.

Figure 3. Ozone profiles used in experiments. Values in g/kg against pressure levels in hPa, empty circles for control profile, full circles for tropospheric increase by 200%, empty squares represent stratospheric reduction by 50% and full squares mean ozone profile based on TOMS data for 15o E, 50o N.
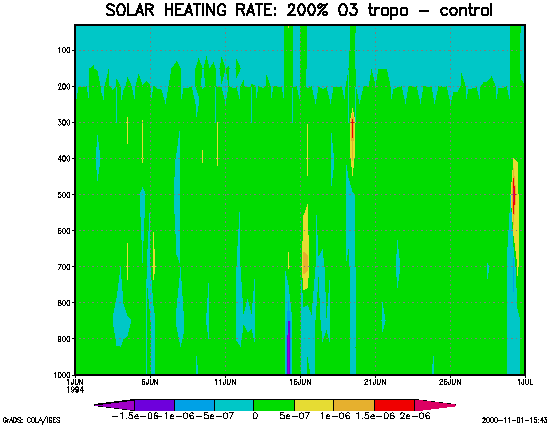
Figure 4. Solar heating rate difference in the middle of model domain (for 15o E, 50o N) in June 1994 sensitivity run with 200% increase of ozone in troposphere against the control run (deg s-1).
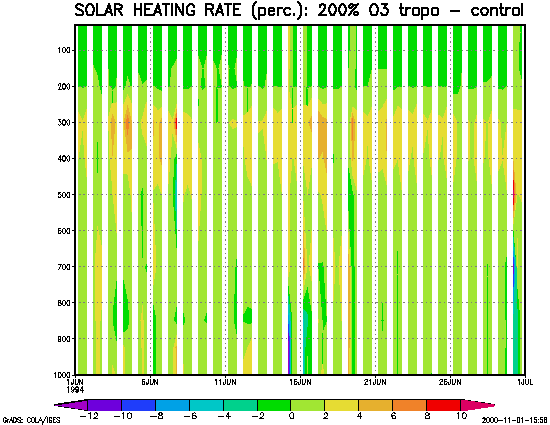
Figure 5. Solar heating rate relative difference in the middle of model domain (for 15o E, 50o N) in June 1994 sensitivity run with 200% increase of ozone in troposphere against the control run (%).
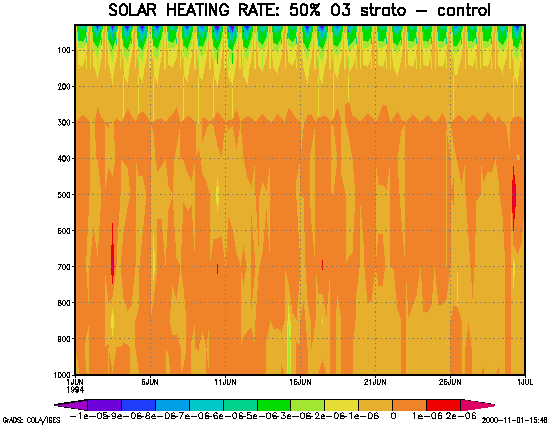
Figure 6. Solar heating rate difference in the middle of model domain (for 15o E, 50o N) in June 1994 sensitivity run with 50% decrease of ozone in stratosphere against the control run (deg s-1).
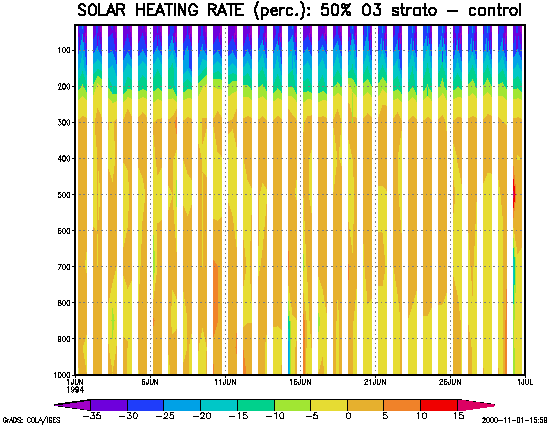
Figure 7. Solar heating rate relative difference in the middle of model domain (for 15o E, 50o N) in June 1994 sensitivity run with 50% decrease of ozone in stratosphere against the control run (%).
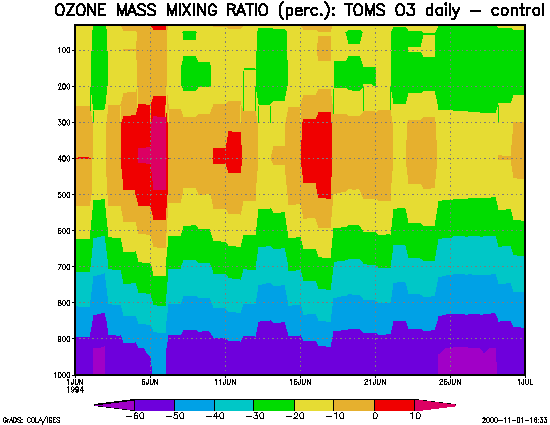
Figure 8. Ozone mass mixing ratio relative difference in the middle of model domain (for 15o E, 50o N) in June 1994 run with ozone profile reconstruction based on TOMS daily total ozone data against the control run (%).
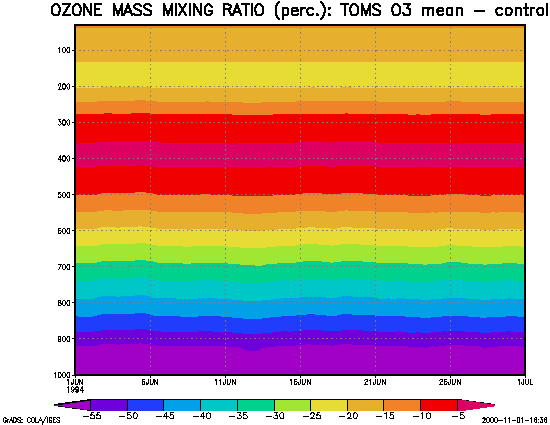
Figure 9. Ozone mass mixing ratio relative difference in the middle of model domain (for 15o E, 50o N) in June 1994 run with ozone profile reconstruction based on TOMS monthly mean of total ozone data against the control run (%)
.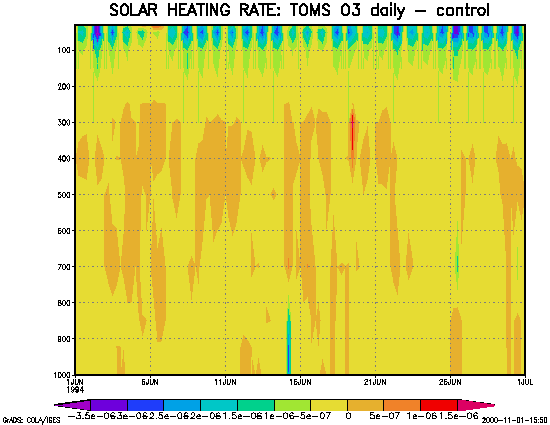
Figure 10. Solar heating rate difference in the middle of model domain (for 15o E, 50o N) in June 1994 run with ozone profile reconstruction based on TOMS daily total ozone data against the control run (deg s-1).
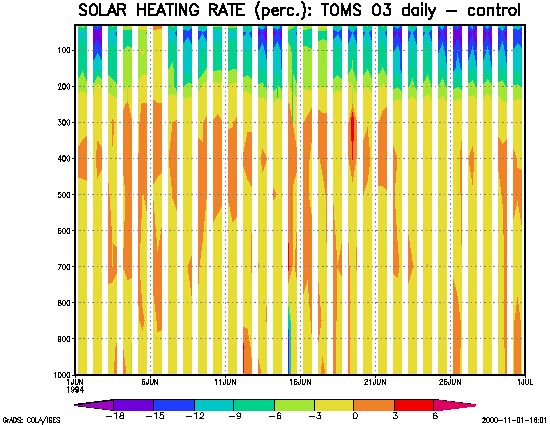
Figure 11. Solar heating rate relative difference in the middle of model domain (for 15o E, 50o N) in June 1994 run with ozone profile reconstruction based on TOMS daily total ozone data against the control run (%)
.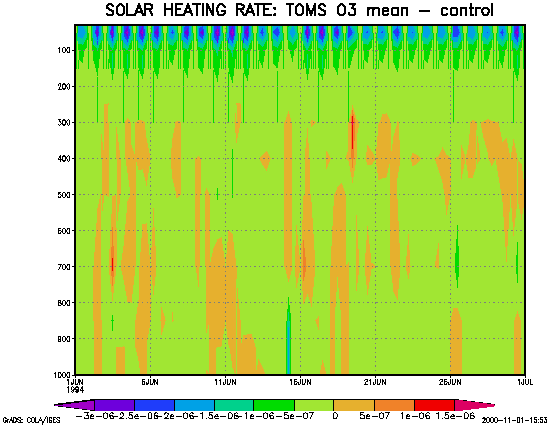
Figure 12. Solar heating rate difference in the middle of model domain (for 15o E, 50o N) in June 1994 run with ozone profile reconstruction based on TOMS monthly mean of total ozone data against the control run (deg s-1).
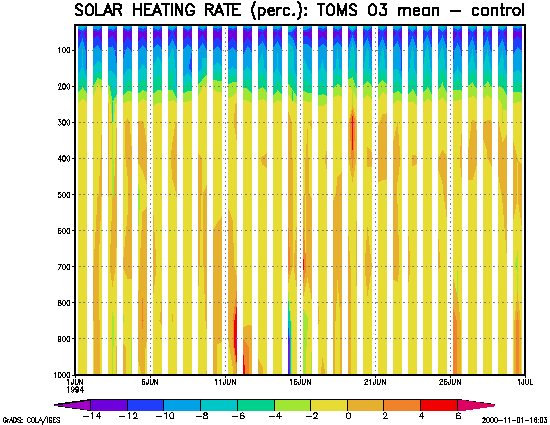
Figure 13. Solar heating rate relative difference in the middle of model domain (for 15o E, 50o N) in June 1994 run with ozone profile reconstruction based on TOMS monthly mean of total ozone data against the control run (%).
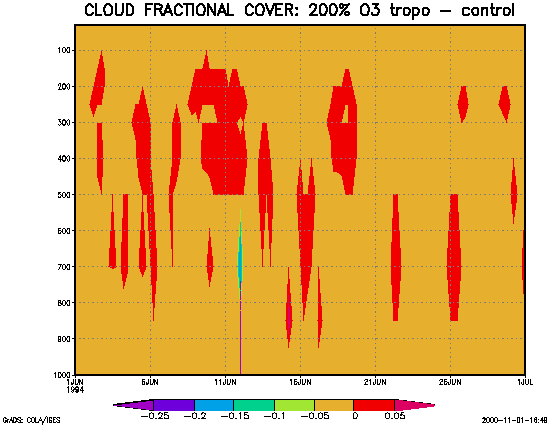
Figure 14. Cloud fractional cover difference in the middle of model domain (for 15o E, 50o N) in June 1994 sensitivity run with 200% increase of ozone in troposphere against the control run.
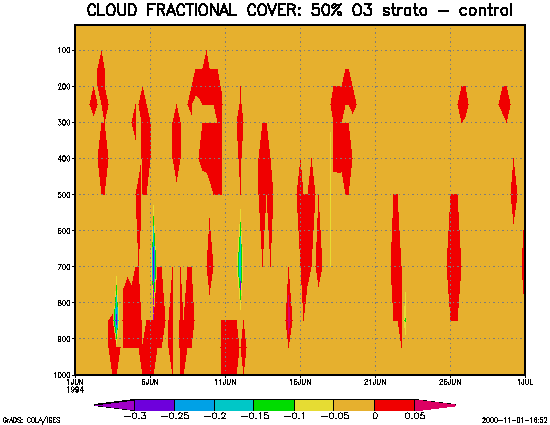
Figure 15. Cloud fractional cover difference in the middle of model domain (for 15o E, 50o N) in June 1994 sensitivity run with 50% decrease of ozone in stratosphere against the control run.
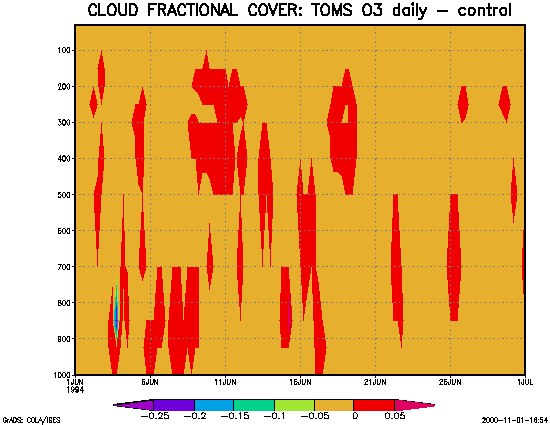
Figure 16. Cloud fractional cover difference in the middle of model domain (for 15o E, 50o N) in June 1994 run with ozone profile reconstruction based on TOMS daily total ozone data against the control run.
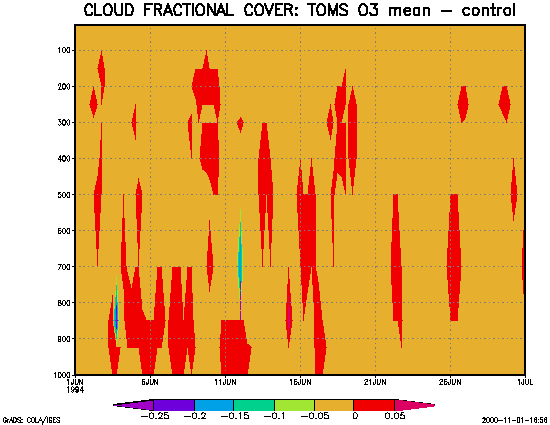
Figure 17. Cloud fractional cover difference in the middle of model domain (for 15o E, 50o N) in June 1994 run with ozone profile reconstruction based on TOMS monthly mean of total ozone data against the control run.
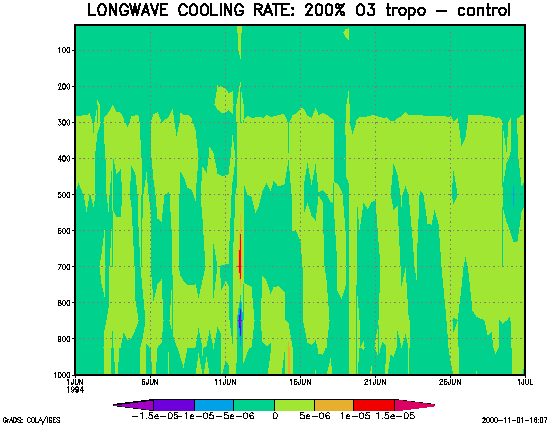
Figure 18. Long wave cooling rate difference in the middle of model domain (for 15o E, 50o N) in June 1994 sensitivity run with 200% increase of ozone in troposphere against the control run (deg s-1).
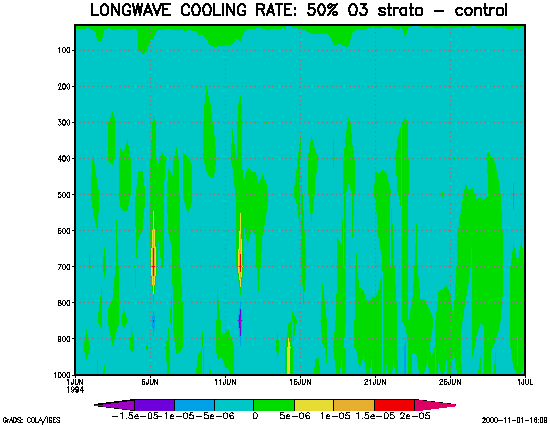
Figure 19. Long wave cooling rate difference in the middle of model domain (for 15o E, 50o N) in June 1994 sensitivity run with 50% decrease of ozone in stratosphere against the control run (deg s-1).
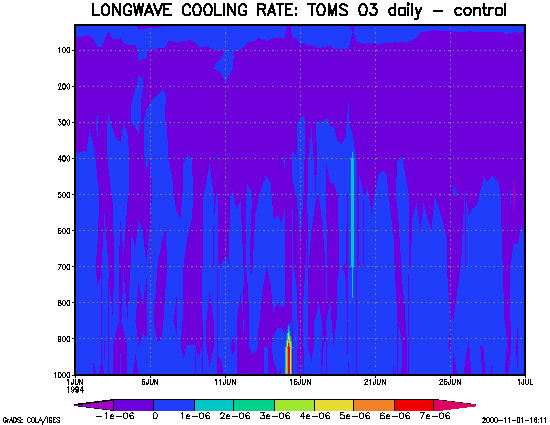
Figure 20. Long wave cooling rate difference in the middle of model domain (for 15o E, 50o N) in June 1994 run with ozone profile reconstruction based on TOMS daily total ozone data against the control run (deg s-1).
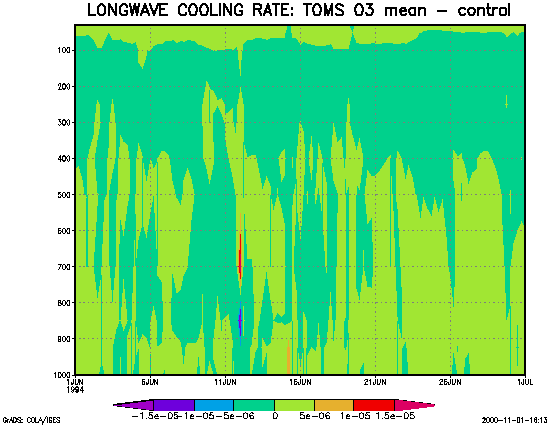
Figure 21. Long wave cooling rate difference in the middle of model domain (for 15o E, 50o N) in June 1994 run with ozone profile reconstruction based on TOMS monthly mean of total ozone data against the control run (deg s-1).
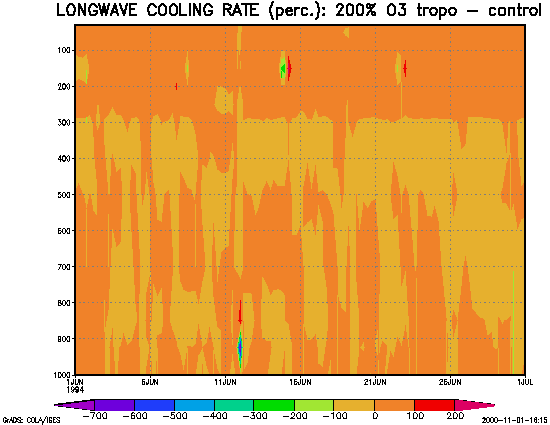
Figure 22. Long wave cooling rate relative difference in the middle of model domain (for 15o E, 50o N) in June 1994 sensitivity run with 200% increase of ozone in troposphere against the control run (%).
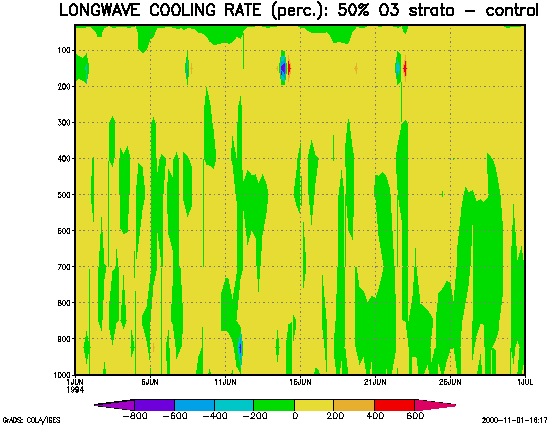
Figure 23. Long wave cooling rate relative difference in the middle of model domain (for 15o E, 50o N) in June 1994 sensitivity run with 50% decrease of ozone in stratosphere against the control run (%).
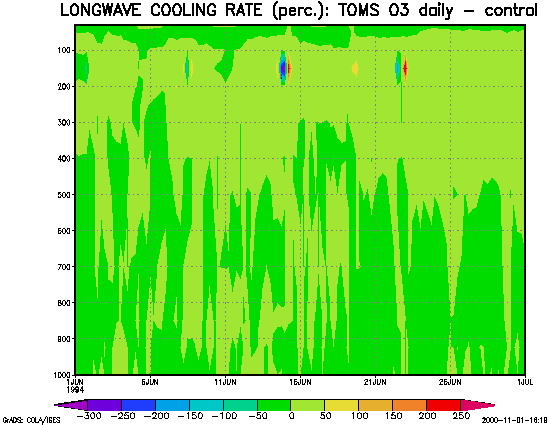
Figure 24. Long wave cooling rate relative difference in the middle of model domain (for 15o E, 50o N) in June 1994 run with ozone profile reconstruction based on TOMS daily total ozone data against the control run (%).
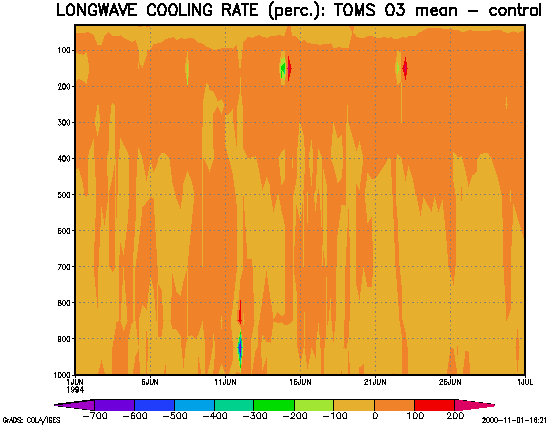
Figure 25. Long wave cooling rate relative difference in the middle of model domain (for 15o E, 50o N) in June 1994 run with ozone profile reconstruction based on TOMS monthly mean of total ozone data against the control run (%).

Figure 26. Detail of the greater negative impact of ozone profile based on monthly mean TOMS data on longwave heating rate. Relative difference (%) against control experiment, for 15o E, 50o N.
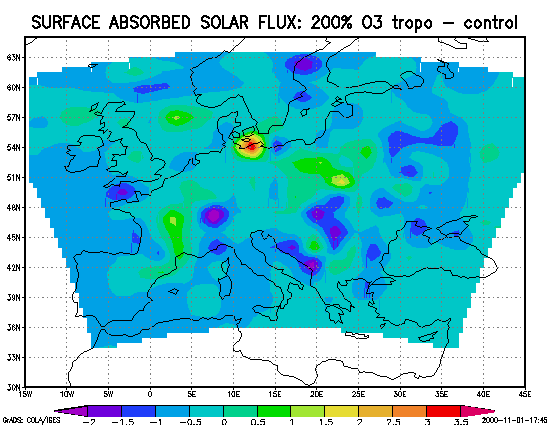
Figure 27. Surface absorbed solar flux difference in June 1994 sensitivity run with 200% increase of ozone in troposphere against the control run (Wm2).
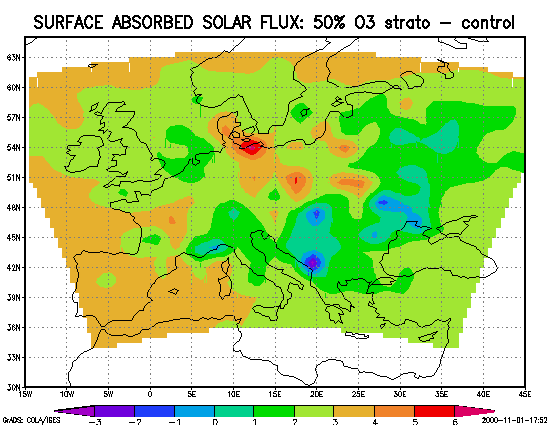
Figure 28. Surface absorbed solar flux difference in June 1994 sensitivity run with 50% decrease of ozone in stratosphere against the control run (Wm2).
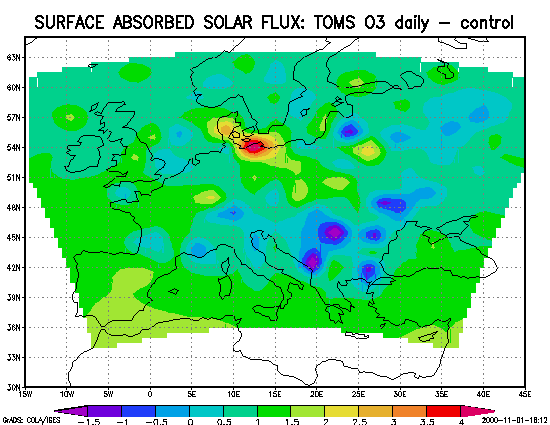
Figure 29. Surface absorbed solar flux difference in June 1994 run with ozone profile reconstruction based on TOMS daily total ozone data against the control run (Wm2).
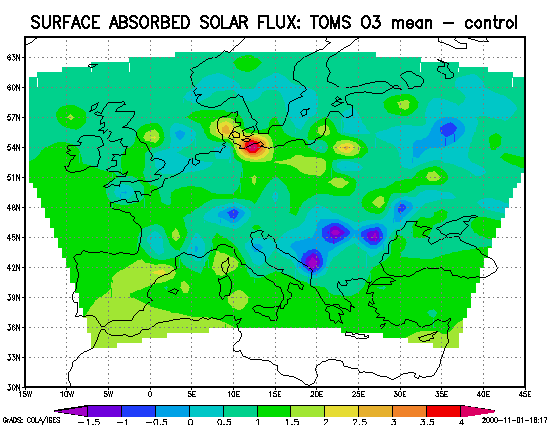
Figure 30. Surface absorbed solar flux difference in June 1994 run with ozone profile reconstruction based on TOMS monthly mean of total ozone data against the control run (Wm2).
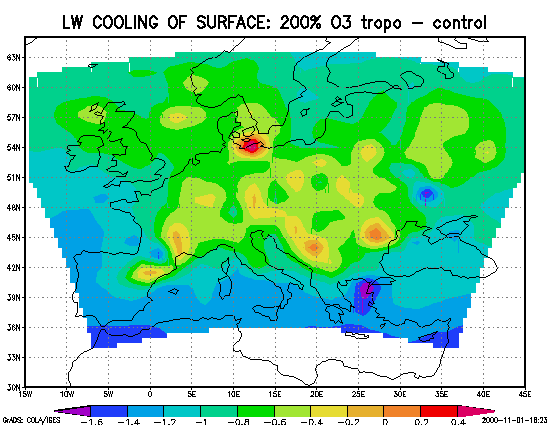
Figure 31. Long wave cooling flux of the surface in June 1994 sensitivity run with 200% increase of ozone in troposphere against the control run (Wm2).
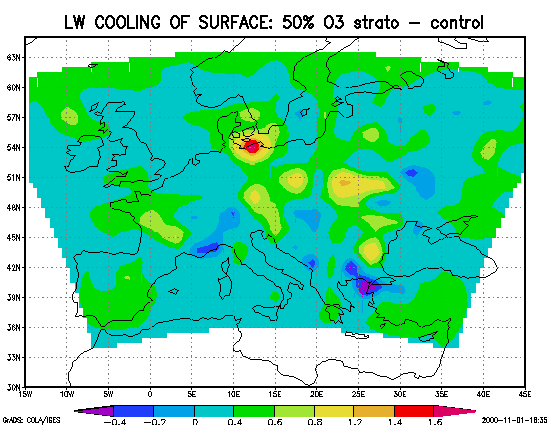
Figure 32. Long wave cooling flux of the surface in June 1994 sensitivity run with 50% decrease of ozone in stratosphere against the control run (Wm2).
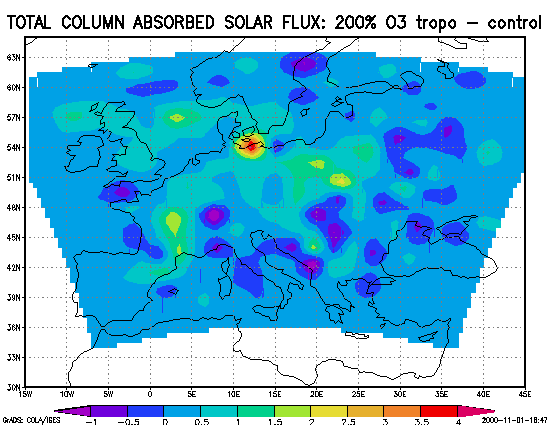
Figure 33. Solar flux absorbed in whole column of the atmosphere in June 1994 sensitivity run with 200% increase of ozone in troposphere against the control run (Wm2).
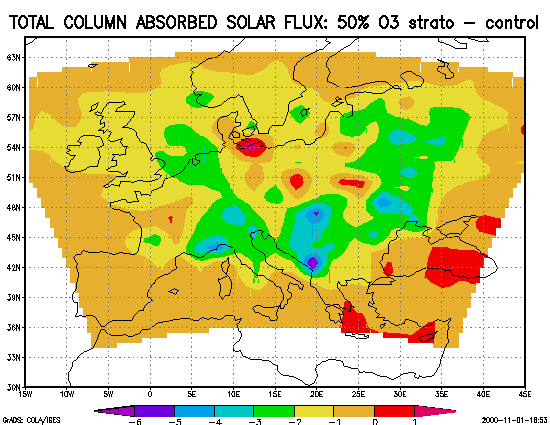
Figure 34. Solar flux absorbed in whole column of the atmosphere in June 1994 sensitivity run with 50% decrease of ozone in stratosphere against the control run (Wm2).
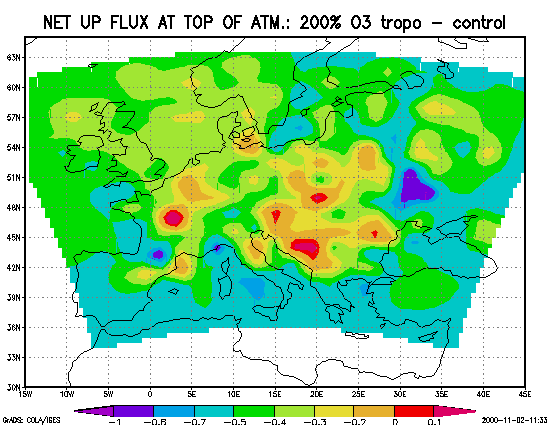
Figure 35. Net up flux at the top of the atmosphere in June 1994 sensitivity run with 200% increase of ozone in troposphere against the control run (Wm2).
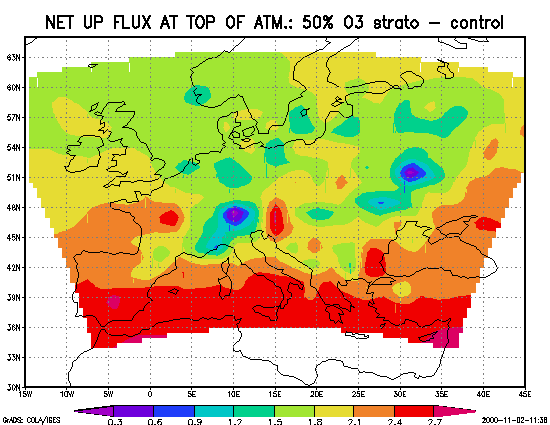
Figure 36. Net up flux at the top of the atmosphere in June 1994 sensitivity run with 50% decrease of ozone in stratosphere against the control run (Wm2).
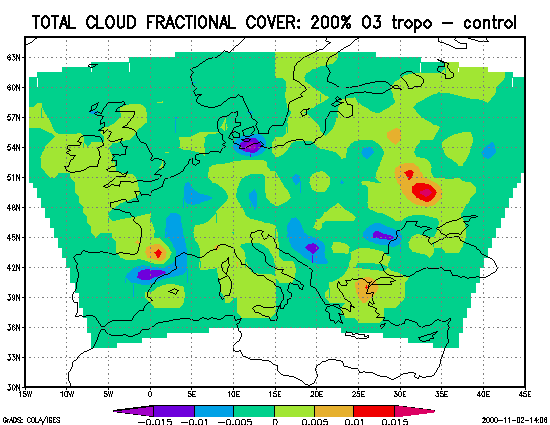
Figure 37. Total cloud fractional cover in June 1994 sensitivity run with 200% increase of ozone in troposphere against the control run.
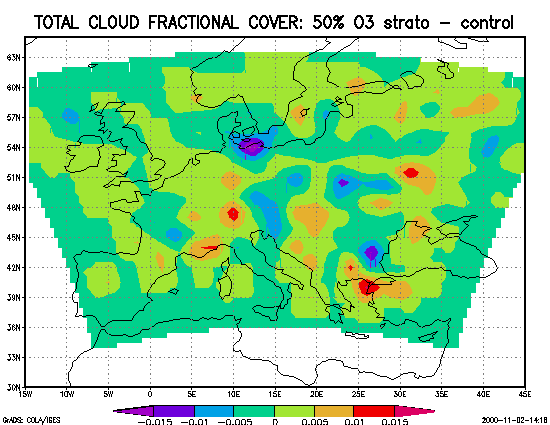
Figure 38. Total cloud fractional cover in June 1994 sensitivity run with 50% decrease of ozone in stratosphere against the control run.
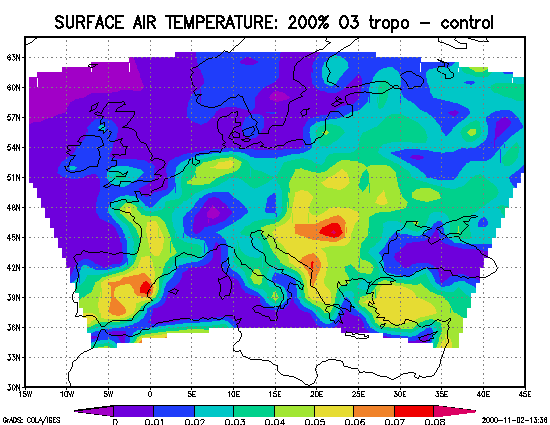
Figure 39. Surface air temperature difference in June 1994 sensitivity run with 200% increase of ozone in troposphere against the control run.
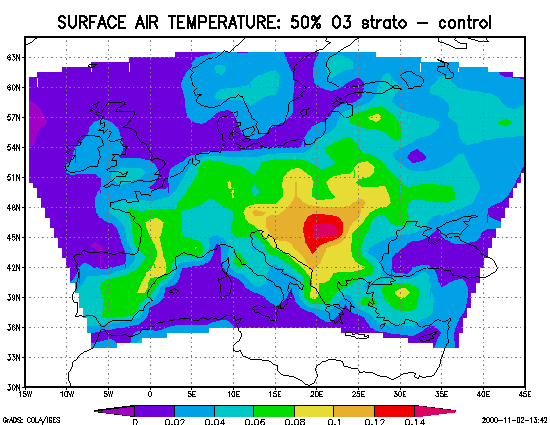
Figure 40. Surface air temperature difference in June 1994 sensitivity run with 50% decrease of ozone in stratosphere against the control run.
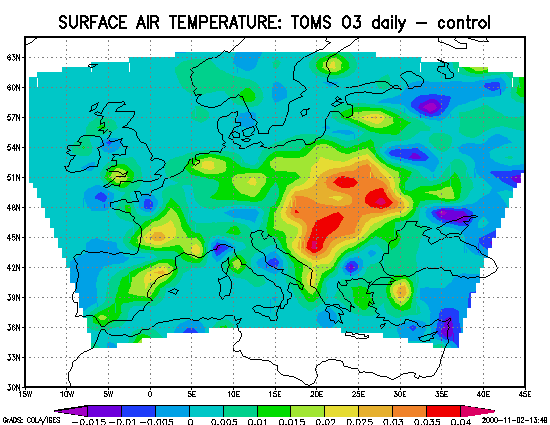
Figure 41. Surface air temperature difference in June 1994 run with ozone profile reconstruction based on TOMS daily total ozone data against the control run.
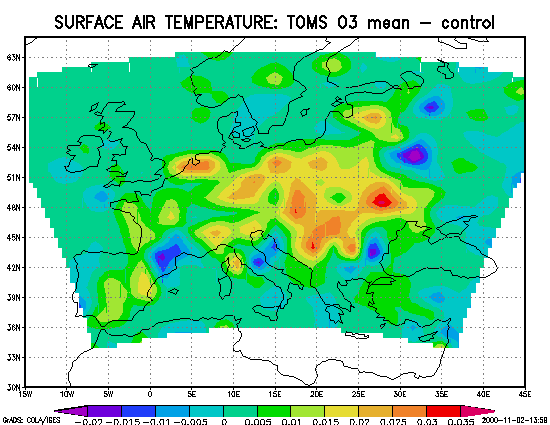
Figure 42. Surface air temperature difference in June 1994 run with ozone profile reconstruction based on TOMS monthly mean of total ozone data against the control run.
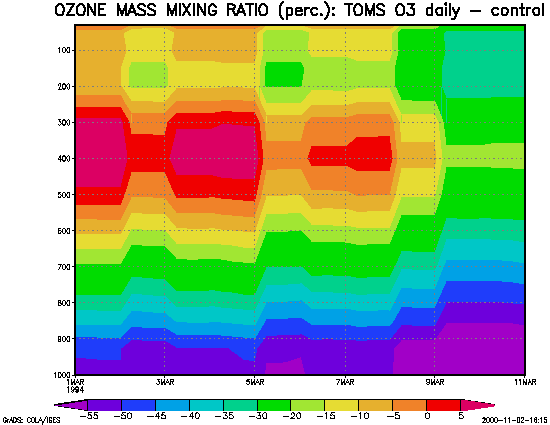
Figure 43. Ozone mass mixing ratio relative difference in the middle of model domain (for 15o E, 50o N) in March 1994 run with ozone profile reconstruction based on TOMS daily total ozone data against the control run (%).
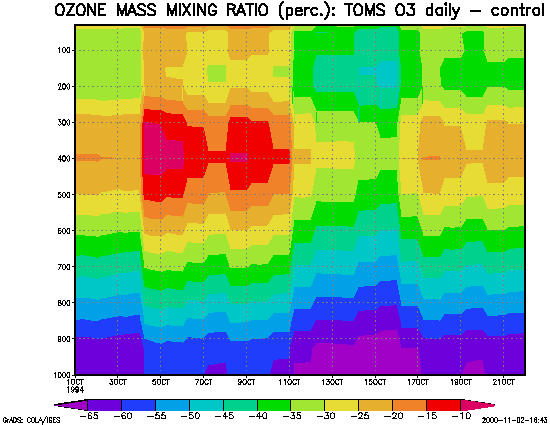
Figure 44. Ozone mass mixing ratio relative difference in the middle of model domain (for 15o E, 50o N) in October 1994 run with ozone profile reconstruction based on TOMS daily total ozone data against the control run (%).
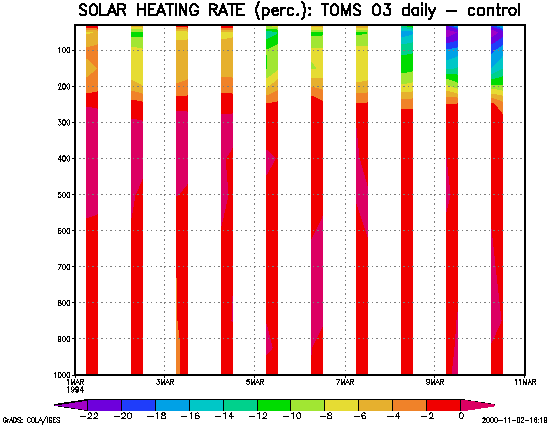
Figure 45. Solar heating rate relative difference in the middle of model domain (for 15o E, 50o N) in March 1994 run with ozone profile reconstruction based on TOMS daily total ozone data against the control run (%).
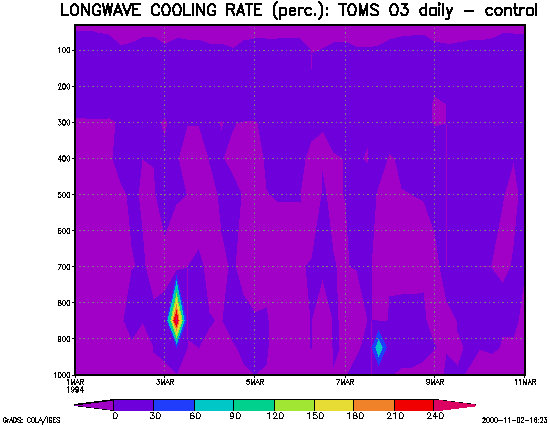
Figure 46. Long wave cooling rate relative difference in the middle of model domain (for 15o E, 50o N) in March 1994 run with ozone profile reconstruction based on TOMS daily total ozone data against the control run (%).
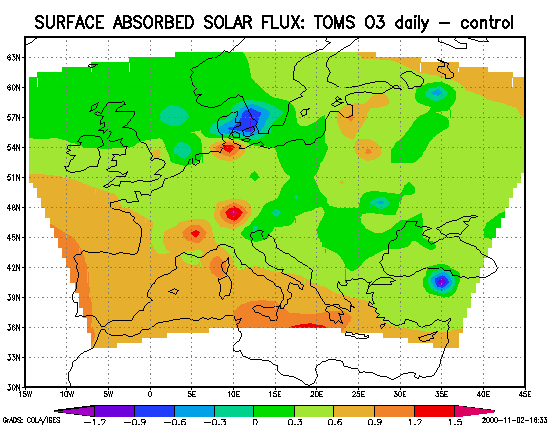
Figure 47. Surface absorbed solar flux difference in March 1994 run with ozone profile reconstruction based on TOMS daily total ozone data against the control run (Wm2).
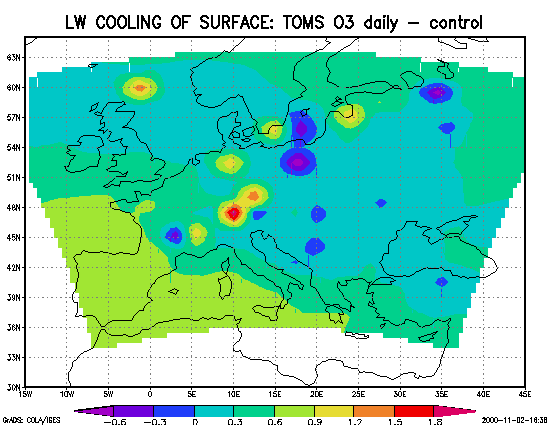
Figure 48. Long wave cooling flux difference at the surface in March 1994 run with ozone profile reconstruction based on TOMS daily total ozone data against the control run (Wm2).
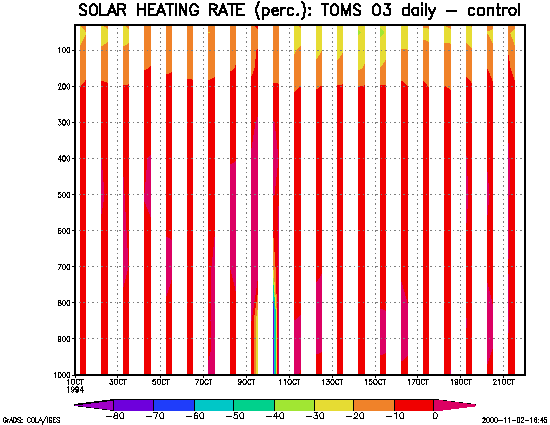
Figure 49. Solar heating rate relative difference in the middle of model domain (for 15o E, 50o N) in October 1994 run with ozone profile reconstruction based on TOMS daily total ozone data against the control run (%).
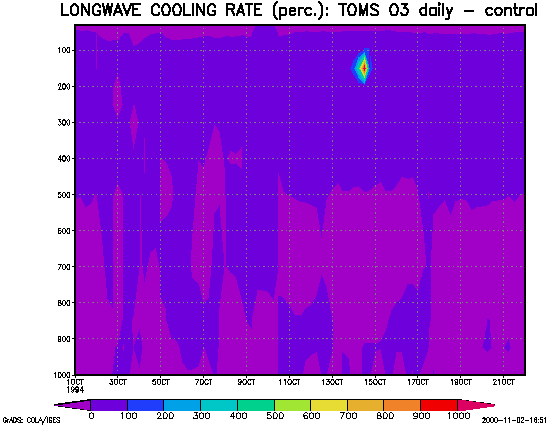
Figure 50. Long wave cooling rate relative difference in the middle of model domain (for 15o E, 50o N) in October 1994 run with ozone profile reconstruction based on TOMS daily total ozone data against the control run (%).
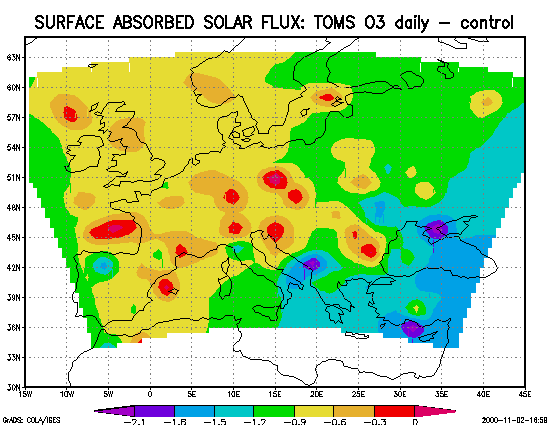
Figure 51. Surface absorbed solar flux difference in October 1994 run with ozone profile reconstruction based on TOMS daily total ozone data against the control run (Wm2).
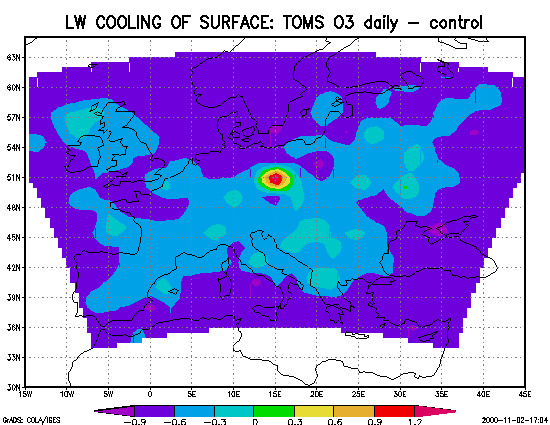
Figure 52. Long wave cooling flux difference at the surface in October 1994 run with ozone profile reconstruction based on TOMS daily total ozone data against the control run (Wm2).
Previous: Parameters Values Next: Conclusions Up: Ext. Abst.