Previous: The Model Next: Acknowledgements Up:Ext. Abst.
Results and Conclusions
Comparisons with UARS-HALOE-satellite data show that MA-ECHAM-CHEM is able to reproduce the main features of temperature, ozone and water vapor distributions in stratosphere and lower mesosphere. The discussion of results focusses on the 70 to 50hPa region of the polar vortices in winter and spring.

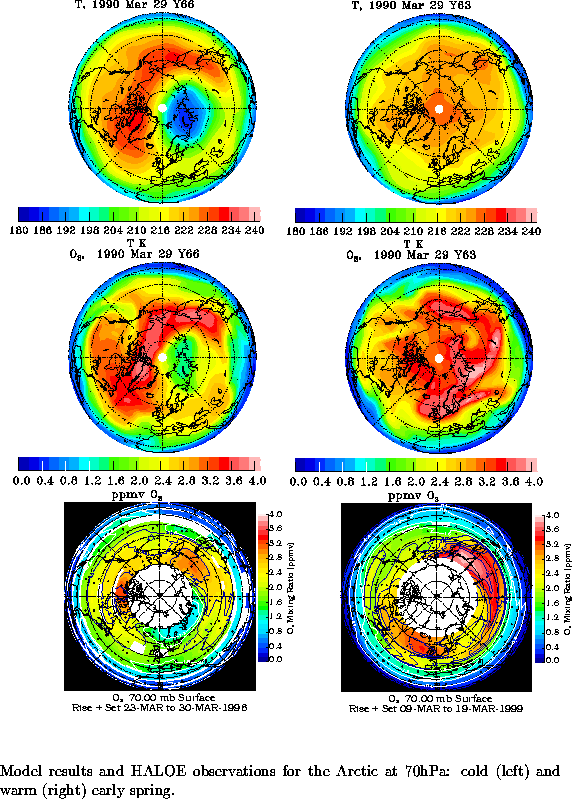
Figure 1
Modelled ozone and temperature for the nineties in the lower stratosphere of the polar vortices (upper four panels, subset covering extremes) agree well with UARS/HALOE satellite observations (lower panels), including interannual variability (slight high bias in ozone because of too much transport from the production area in low latitudes).


Figures 2 and 3
Almost realistic PSC-distributions (lower panels, 15 years average, despite only solid PSCs) compared to SAM-observations (upper panel, Poole and Pitts, 1994) are calculated, however somewhat overestimated in the upper part of the lower stratosphere due to a slight cold bias of model and in the lowermost part due to too much diffusion of water vapor from the troposphere. PSCs in individual years are consistent with the development of ozone. Mid winter warmings are simulated in the Arctic.
Settling of ice particles in Antarctic winter causes realistic dehydration and downward transport of HNO3 in the lower stratosphere (not shown, paper in preparation).

Figure 4
Change in PSC-probability from 1960 to 1990, Antarctic left, Arctic right.

Figure 5
Same for 1990 to 2030.
Cooling of stratosphere by greenhouse gases causes earlier onset of PSCs comparing 1960 with 2030. Antarctic PSCs persist longer in 1990 due to ozone feedback.
The following set of figures shows how the mean values and standard deviations in the polar vortices change in the different 'time slice' experiments.
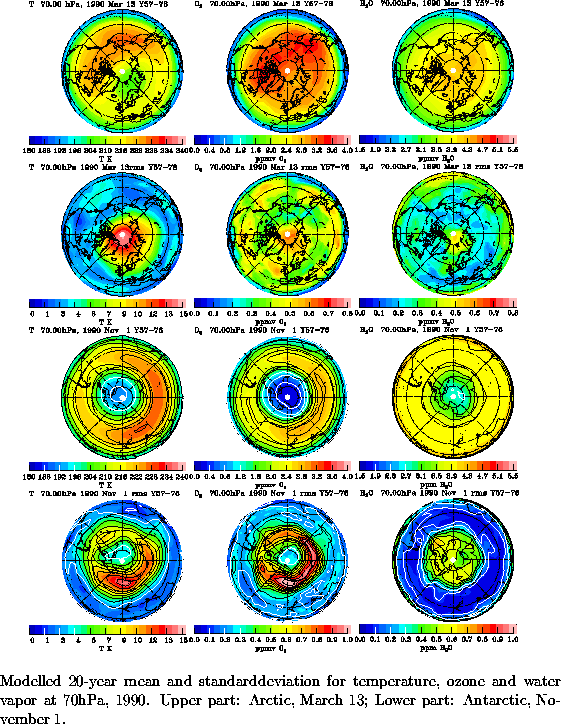
Figure 6
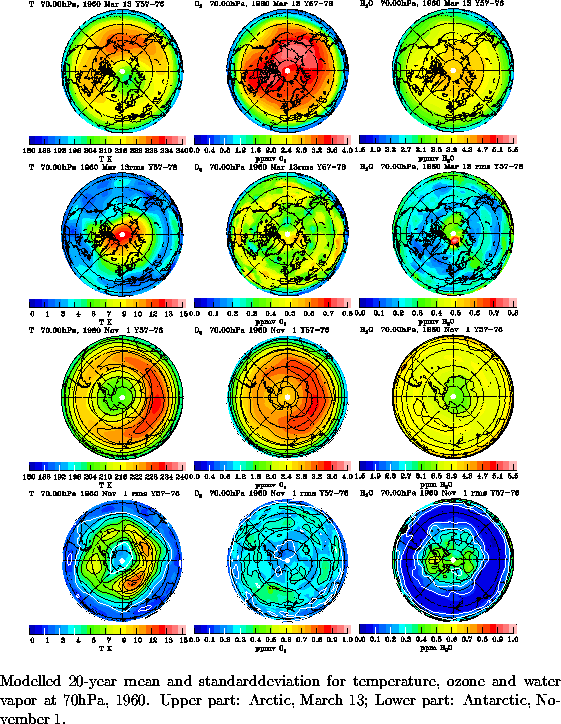
Figure 7
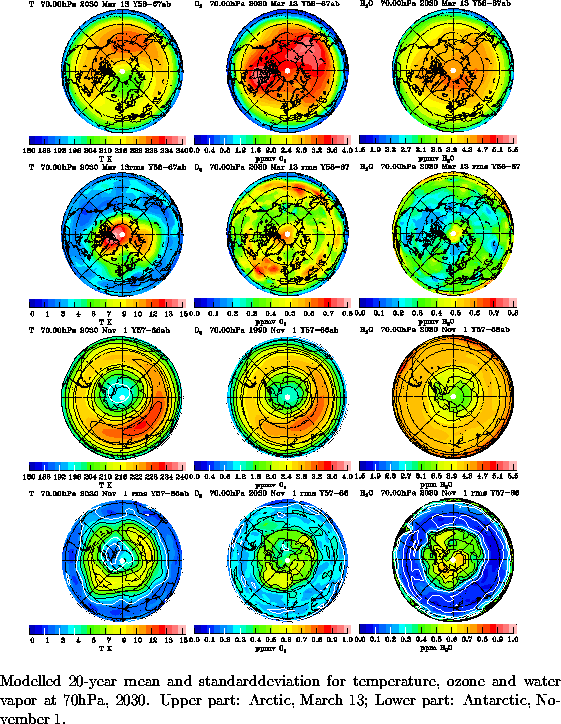
Figure 8
Variability in the lower stratosphere is amplified by ozone and water feedback (via PSCs and radiative heating) and largest near the pole in the Arctic (March) and around 60o in Antarctic (September to late October), as observed. In 2030 it looks like, that a position of the Arctic vortex near Europe is more likely than in the present.
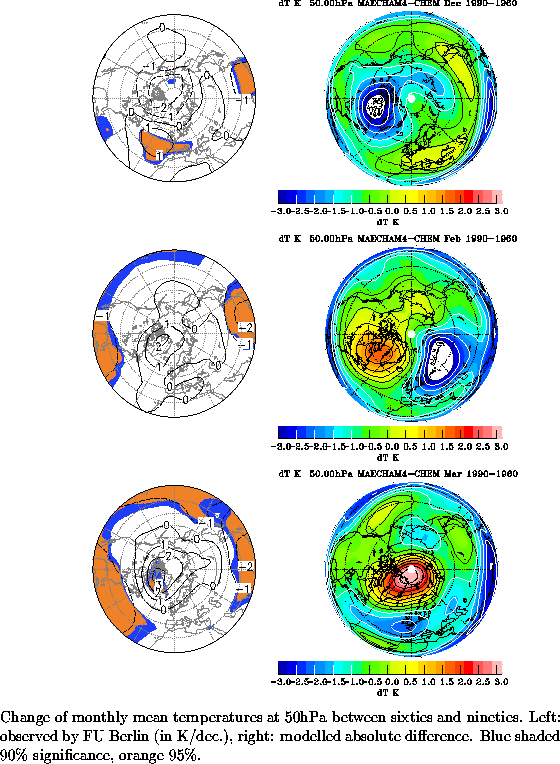
Figure 9
Patterns of temperature trends from sixties to nineties are similar to Berlin data, except the overestimate of modelled cooling near Russia in February. Warming near the pole is calculated and observed in March, cooling in winter.
Temperature changes in the middle and upper stratosphere in high latitudes are significantly modified by changes in the mean circulation (descent rate, see Poster by Manzini et al, P/3-1.5).
Recovery of ozone due to chlorine reductions is calculated for 2030, increase of variability computed for North Atlantic and Asia, but not Northern Europe (most likely position of vortex). A Northern ozone hole is not likely, at least not for the 2030 conditions. A further run with 2015 conditions, which have still chlorine as high as 1990 but enhanced stratospheric cooling by CO2 is to be evaluated for that aspect.