Meteorological Research Institute , 1-1 Nagamine, Tsukuba, Ibaraki
305 Japan
e-mail : kshibata@mri-jma.go.jp
FIGURES
Abstract
The effects of solar maximum and minimum on the climate is investigated with a GCM at Meteorological Research Institute (MRI/JMA98 GCM). As forcings on the model resulting from solar variability, solar irradiance in UV range and ozone climatology are changed. The UV changes at solar maximum and minimum(Smax and Smin) of the original dataset in 119-420 nm (Lean et al.,1997) is used only for a longer wavelength region (200-420 nm). Relative change between Smax and Smin, i.e., (Smax - Smin)/Smin is added to or subtracted from the climatological ozone for solar maximum and minimum runs, respectively. Two different ozone dataset are used. One is based on Imperial College(ImpC) 2-D chemical model, and the other is based on Goddard Institute for Space Studies(GISS) 2-D chemical model, which includes 3-D temperature effect through 3-D dynamics.

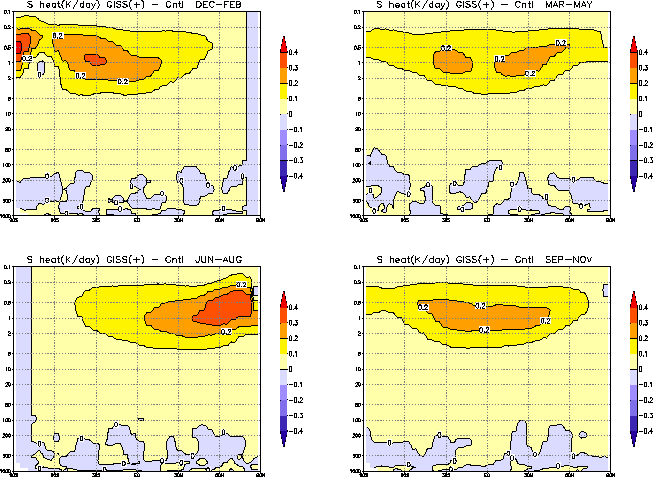
Figure 1. Latitude-height cross section of the change in solar heating rate averaged for 3-month(Dec-Feb, Mar-May, Jun-Aug and Sep-Nov) for solar max and GISS ozone run.
The model is also integrated for 21 years under solar maximum
and minimum conditions(experiment runs). Since there are two ozone
datasets, there are four experiment runs in total.
The change in solar heating rate for Smax and GISS ozone run shows that the solar forcing is confined near the stratopause and within about 0.4 K/day, as shown in Fig.1. ImpC ozone gives similar forcing except for the minimum solar heatings about 70N in Dec-Feb and 90S in Jun-Aug at the stratopause level. This is due to ozone minimum concentration caused by dynamical effect. Note that, in Smin runs, negative change of the same strength appears in the middle atmosphere.

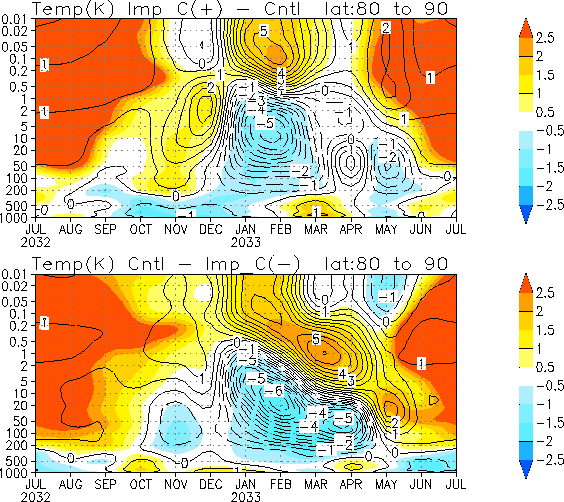
Figure 2. Time-height cross section of zonal mean temperature response in North Pole, averaged over 80N-90N, of ImpC ozone run for (upper) solar max and (lower) solar min. Contour(0.5 K/day interval) and color shading represent temperature and Student's t value, respectively. For 20 years ensemble, 95% and 80% significance correspond to about 2.02 and 1.30 Student's t value, respectively.
In summer or low latitude middle atmosphere, where radiative forcing
is much larger than dynamical forcing, model responses are very
radiative and significant both for Smax and Smin runs, in which warming and cooling of 0.4-0.8 K/day occur, respectively.
In northern winter middle atmosphere, on the other hand, dynamical response similar to the polar-night jet oscillation appears, being less significant than radiative response in summer middle atmosphere. For ImpC ozone, zonal wind response of poleward and downward propagation is similarly occur from January to February both in Smax and Smin runs, but the response over the entire wintertime is different as seen in the evolution of polar temperature response(Fig.2). The slowly descending mode of positive and negative anomalies during January and February almost disappear in March.
For GISS ozone, zonal wind response of poleward and downward propagation
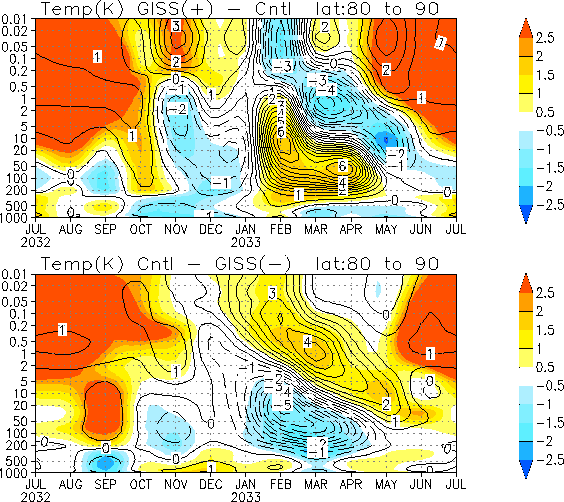
is similarly seen in December and January both in Smax and Smin runs, but the response from February is opposite as shown in
the evolution of polar temperature response(Fig.3). The abrupt
change between January and February seems to be responsible for
this opposite response.

Figure 3. The same as Fig.2 except for GISS ozone.
Comparison of Fig.2 and 3 indicates that for solar maximum experiment,
mid-winter responses are different (opposite in February and March)
for GISS and ImpC ozone data. However, slowly descending modes
can be seen in both experiments. For solar minimum experiment,
responses are very similar for the two ozone data. The slowly
descending modes are clearly identified.
Ensemble average of four members under an assumption of linear response demonstrates that the solar maximum impact induces stratospheric cooling in northern high-latitudes in winter, and vice versa. The slowly descending temperature anomaly becomes strong from January through April.
The difference in the time evolutions of four runs is due to the interaction between wave and mean-flow, which is not yet comprehensively analyzed. There is only one common feature for the planetary wave propagation in October, when solar heating excess(deficit) due to solar variability intensifies (weekens) the climatological upward and equatorward planetary wave propagation in the midlatitude upper stratosphere. In November and December, on the other hand, strong non-linear wave mean-flow interaction results in very small common feature.
Back to
| Session 1 : Stratospheric Processes and their Role in Climate | Session 2 : Stratospheric Indicators of Climate Change |
| Session 3 : Modelling and Diagnosis of Stratospheric Effects on Climate | Session 4 : UV Observations and Modelling |
| AuthorData | |
| Home Page | |