National Center for Atmospheric Research, Boulder, CO - USA
Caltech-Jet Propulsion Lab, Pasadena, CA - USA
Hampton University, Hampton, VA - USA
Direct Correspondance to: andrew@ucar.edu
›
FIGURES
Abstract
The interannual variability of the tropical tropopause region
between 14 and 18 km is examined using observations of convection,
winds and tropopause temperatures from reanalyses and water vapor
from satellites. This variability is compared to a simulation
using the Community Climate Model version 3 (CCM3) general circulation
model forced by observed sea surface›
temperatures. Outgoing Longwave Radiation (OLR) is used to diagnose
convection, and the thermal tropopause temperature is used to
diagnose changes in the tropopause.
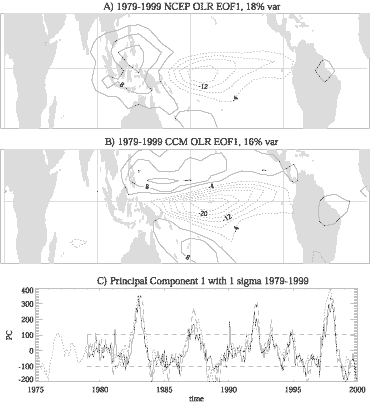
A coherent picture of the effect of the El-Nino Southern Oscillation (ENSO) is presented in the NCEP/NCAR reanalyses and CCM3. ENSO modifies convection in the tropics as illustrated in Figure 1 below for the first EOF of OLR in the observations (A) and the model (B). The principal component (PC) timeseries in Figure 1 (C) track each other, and the ENSO SST anomalies (dotted line) closely.

FIGURE 1: A) Leading EOF mode of deseasonalized Outgoing Longwave Radiation (OLR) from monthly NCEP analyses. Analyzed from 1979--1999 in units of W m-2 per standard deviation of principle component time series. B) Leading mode for 1979--1999 OLR from CCM3 run forced by observed SST's. C) Solid Line: Principle component (PC) time series of the EOF in (A). Dashed Line: PC of the model EOF in (B). Dotted line: scaled Nino3 (see text) SSTA. Dashed horizontal lines represent +/-1s of all three time series.
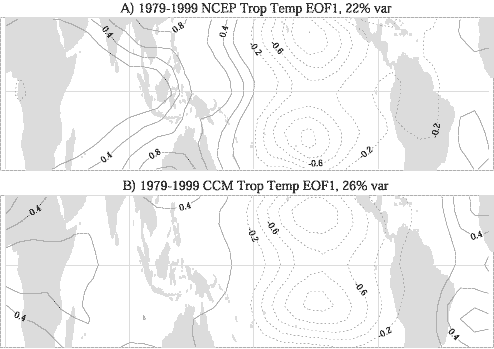
ENSO also modifies the tropopause temperature signficantly, illustrated in Figure 2.› The PC timeseries of the first EOF pattern of reanalysis tropopause temperature (Figure 2A) is strongly correlated with ENSO SST anomalies (~0.7 linear correlation). The temperature and circulation changes (not shown) in the tropical tropopause region are in agreement with theories of tropical heating. CCM3 (Figure 2B) reproduces most details of these changes, but not the zonal mean temperature variations present in the analysis fields, which are not related to ENSO.›

FIGURE 2: First EOF of thermal tropopause temperature anomalies 1979-1999, scaled to units of degrees C per standard deviation of the PC. (A) NCEP/NCAR reanalysis tropopause. (B) CCM3 tropopause.
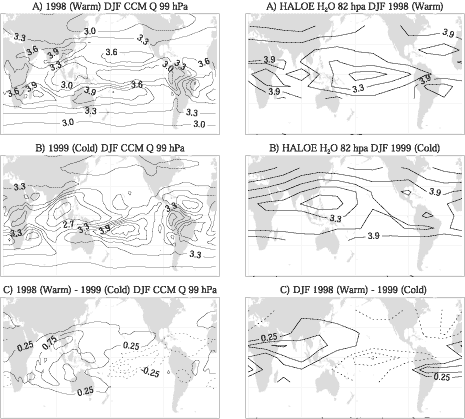
ENSO also forces significant changes in observed and simulated water vapor fields. In the upper troposphere water vapor is a maximum near convection, in both the model (Figure 3 Left Panels), and observations from satellites (Figure 3 Right Panels). The model is able to capture the broad difference patterns present in the observations. (Compare Panels C below).› Note also the shift of the water vapor minimum from on the equator over the central pacific during ENSO warm events (Figs 3A) to north of the equator during ENSO cold events (Figs 3B).

FIGURE 3: December-February averaged water vapor mixing ratio from CCM3 at 99 hPa (left panels) and HALOE at 82 hPa (right panels). A) 1997--1998 (ENSO Warm) and B) 1998--1999 (ENSO Cold). Contour interval of 0.3 ppmv. C) Difference between these two seasons (contour interval 0.25 ppmv).
›
However, in the tropopause region (at ~200 hPa) water vapor is
a minimum in the regions of convection and surrounding it (not
shown). Convection, cirrus clouds, temperatures and transport
are all linked to describe the water› vapor distribution and highlight
the role of transport in the tropopause region.
For a complete copy of this work please visit: http://www.asp.ucar.edu/~andrew/papers.html
Back to
| Session 1 : Stratospheric Processes and their Role in Climate | Session 2 : Stratospheric Indicators of Climate Change |
| Session 3 : Modelling and Diagnosis of Stratospheric Effects on Climate | Session 4 : UV Observations and Modelling |
| AuthorData | |
| Home Page | |