Previous: Introduction Next: The waveguide modulations Up: Ext. Abst.
The composite results
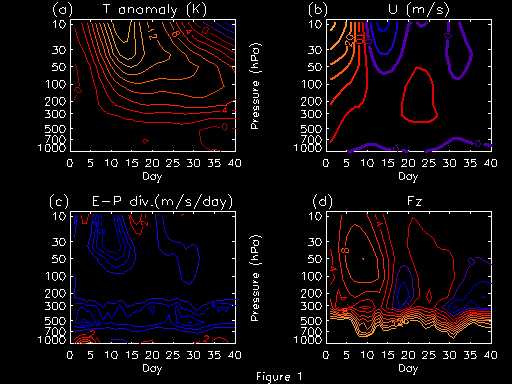
Instead of studying individual episodes, we use composite method to study common characteristics of each category. Although the lasting time varies in different episodes, we select each period consisting of 40 days and arrange those periods according to their maximal amplitudes at 10 hPa without lose of generality. The composite results include temperature anomaly, zonal mean wind, Eliassen-Palm flux and its divergence. The E-P diagnostics are used to examine wave-mean flow interactions (Andrews and McIntyre, 1976; Edmon et al., 1980), which are very important links between stratosphere and troposphere. All of the quantities are calculated from the NCEP/NCAR Reanalysis daily data. The composite figures of propagating case are given in Figure 1. The downward propagating feature seems to consist of two stages. The initial stage is faster, taking just a few days down from 10 hPa to 50 hPa level, and the following stage is slower, with about three weeks of propagating time from 50 hPa to 200 hPa. In the first stage, the upper stratosphere westerly wind reversed to easterly rapidly. The "critical line" (zero wind line) descended to below 50 hPa. Because waves cannot propagate in easterly wind (Charney and Drazin, 1961), the altitude of wave transport also descended with the "critical line." The largest zonal wind deceleration took place in the same time and same place of the maximum wave forcing, as shown by the convergence of E-P flux. Very large poleward heat flux ( which is proportional to the vertical component of E-P flux) occurred in this stage. After a short interruption, a second pulse of wave flux took place, which again forced the polar wind to decelerate and the "critical line" to descend. Although the second pulse of wave is not so strong as the first pulse, it plays a deciding role for warm temperature propagating downward, as will be discussed later. Figure 2 shows the composites of the non-propagating case. Compared to the propagating case, there is no significant warming below 100 hPa although the warm anomaly at 10 hPa is about as large in the two categories. There is no clear downward propagating feature in the upper stratosphere. The zonal wind was weakened but did not change direction. This is consistent with the weaker wave forcing in the upper stratosphere, with the convergence of E-P flux only half as large as that in the propagating case. It was also limited at higher altitudes and lasted for a shorter period. The amplitude of vertical component of E-P flux was initially as large as that in the propagating case, but faded away earlier near the tropopause. There was no second pulse of wave flux following up, therefore, the upper warm anomaly did not extend to lower altitudes.
Figure 1. Composites for the propagating warm anomalies. All quantities shown are 70N-90N average and smoothed by a 5-day running average. (a) Polar temperature anomaly. The contour interval is 2 K; (b) Zonal wind. The contour interval is 5 m/s and the heavy purple line indicates zero wind ; (c) E-P flux divergence. The contour interval is 2 m/s per day, zero line is omitted, and negative values are shown in blue; and (d) Vertical component of E-P flux. The contour interval is 2 kg/m/s/s, and contours with value greater than 16 are omitted.
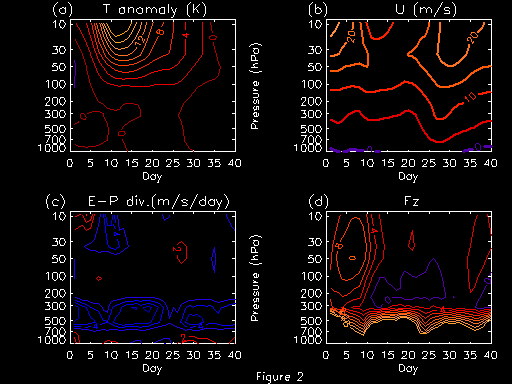
Figure 2. Same as Figure 1 except for the non-propagating warm anomalies.