Role of Asia Pacific wave on stratosphere-troposphere exchange
K.
Mohanakumar, V. Sathiyamoorthy and P. V. Joseph
Department
of Atmospheric Sciences, Cochin University of Science & Technology,
Cochin 682 016, India
FIGURES
Analysis of the NCEP/NCAR
reanalysis wind data shows the presence of a stationary wave train extending
into the lower stratosphere during summer. This wave train is seen prominently
upto 70 hPa level, confined between 10°
N and 50°
N latitudes and has a zonal
wave number of 6 or 7. It is an extension of the Asia Pacific Wave of the
troposphere reported by the earlier studies into the stratosphere. Above
200 hPa level this wave shows a phase shift of 20 degree longitude between
deficient and excess Indian summer monsoon rainfall years. Amplitude of
this wave is maximum around 200 hPa and decreases both above and below.
The large amplitude portion of this wave is thus situated in the break
region of the tropical and subtropical tropopause around 30°
N latitude. The large amplitude
Asia Pacific Wave (APW) is found to exchange the tropical and subtropical
air masses through the tropopause break and thus the APW is also seen in
the satellite monitored total ozone (TOMS data).
Introduction
Transport between stratosphere and troposphere across tropopause can take place by many dynamical processes. These include global scale Brewer-Dobson cell, quasi-isentropic mixing by large scale eddies, tropical cumulonimbus cloud penetration in to the stratosphere, tropopause folds associated with mid-latitude baroclinic instability, wave activity etc. Mainly tropospheric mass enters into the stratosphere in the equatorial region by the rising branch of the Brewer-Dobson cell, cumulus cloud penetration etc. On the other hand, stratospheric air enters the troposphere by the tropopause fold phenomena and other synoptic and smaller scale circulation processes. Recently more attention has been shifted from synoptic and smaller scale stratosphere troposphere exchange to global scale in which stratospheric zonal mean circulation plays a major role (Holton et al, 1995). Number of observational evidences suggests that the lower part of the extratropical circulation cannot be simply explained by this global scale mean circulation (Wirth and Egger, 1999). Complete understanding of the smaller scale stratosphere troposphere exchange processes are important for the chemical and ozone distribution in the upper troposphere and lower stratosphere.
Asia Pacific Wave in troposphere
Joseph and Srinivasan (1999), (now onwards JS) using NCEP/NCAR reanalysis data (Kalnay et al, 1996) showed the presence of a large amplitude standing Rossby Wave in the upper tropospheric westerlies during May confined between 10°N and 50° N latitudes. This wave has wavelength of about 50-60° longitude (zonal wave number 6 or 7) and has a spatial shift of about 20° longitude between deficient and excess Indian Summer Monsoon Rainfall (ISMR) years with a wave trough over the Arabian sea during deficient ISMR years. The spatial shift is due to the shift in the longitudinal position of the convective heat sources associated with the Inter Tropical Convergence Zone. Due to its geographical location, it was named by JS as Asia Pacific Wave (APW). It is reported that this wave has large amplitude around 200 hPa and the amplitude decreases with decreasing height in the troposphere. Although the lower portion of this wave has been studied in detail, nature of this wave above 200 hPa has not been documented. It is interesting to know whether the APW is seen above 200 hPa in the lower stratosphere. If it is present, first it could couple the troposphere and stratosphere directly on global scale and communicate some information from the tropospheric Indian summer monsoon activity to stratosphere and, secondly it could exchange tropical upper tropospheric air mass and extra tropical lower stratosphere air mass in meridional direction along isentropic surfaces.
In the present work, the nature of APW in wind above 200 hPa level is studied. The importance of the location of the APW and possible meridional mass exchange including that of ozone by this wave is highlighted. It is also shown how the environmental conditions associated with extreme ISMR affect the distribution of total ozone amount over an area in the inter-annual time scale.
Gridded wind (both u and v) and temperature data with a horizontal resolution of 2.5º lat x 2.5º lon are available for 17 levels, from surface to 10 hPa in the NCEP/NCAR reanalysis data set (Kalnay et al, 1996). Monthly mean values of wind at 300, 200, 150, 100, 70, 50, 30, 20 and 10 hPa levels for the period 1979-1994 are used for the present analysis. Temperature data at all the 17 levels have been analysed to understand the tropopause break. Gridded monthly mean total ozone data (version 7) measured by the TOMS instrument onboard Nimbus-7 spacecraft is used for the ozone analysis (Stanford et al, 1995). This data set has 1º lat x 1.25° lon spatial resolution and covers the period November 1978 to April 1993.
Indian summer monsoon rainfall data has been taken from Parthasarathy et al (1994). ISMR is the area weighted average June to September rainfall of 306 stations well distributed over India. The long period average ISMR is 852.4 mm and its standard deviation is 84.69 mm. Table 1. gives the ISMR for the 1979-93 period. The 3 dry years are the years of maximum rainfall deficiency while the 3 wet years are the years of maximum rainfall excess. During the study period 1979-1993 the years 1979, 1982 and 1987 are dry monsoon years and 1983, 1988 and 1990 are wet monsoon years. All these years have rainfall excess/deficiency more than one standard deviation from the long period average except 1990 (Table.1).
|
Year |
Percentage Departure
(mm) from 1871 93 mean |
|
1979 1980 1981 1982 1983 1984 1985 1986 1987 1988 1989 1990 1991 1992 1993 |
-16.96 3.57 -0.02 -13.73 12.12 -1.84 -10.86 -12.83 -18.20 12.80 1.68 6.61 -7.91 -7.91 2.89 |
Table.1 Indian Summer
Monsoon Rainfall (mm) (Parthasarathy et al 1994)
In order to study the characteristics of the APW, gridded NCEP/NCAR mean meridional wind data during the month of May were selected for the analysis. Climatology for the 13 year period 1982-1994 available in the CD-ROM supplied along with Kalnay et al (1996) for the 9 levels considered (300, 200, 150, 100, 70, 50, 30, 20, 10 hPa) was used to calculate meridional wind anomaly at each grid point for composites of DRY and WET ISMR years.
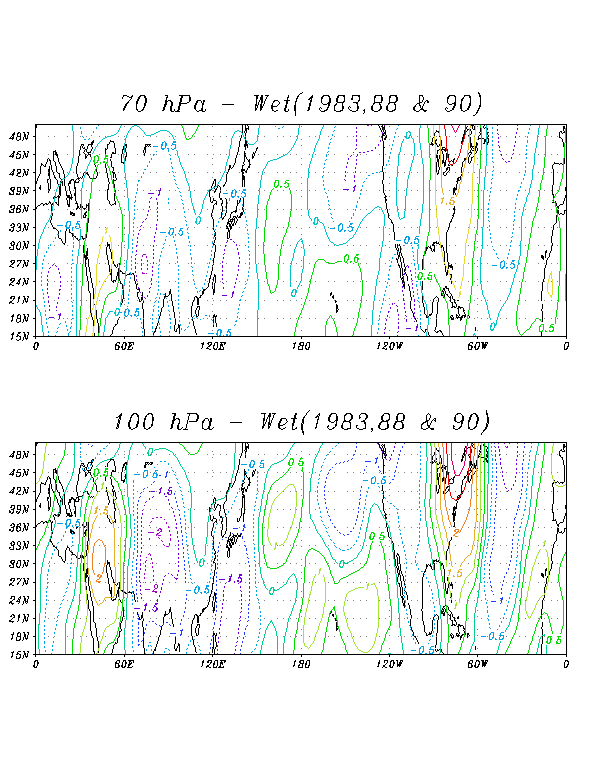
In Figs. 1(a-d), meridional wind anomaly for the composite WET ISMR years for 4 levels viz., 300, 200, 100 and 70 hPa and in Fig. 2, meridional wind anomaly for the composite DRY ISMR years for 200 hPa level only are presented. Prominent stationary Rossby wave signal is seen in these figures at all levels. It has a wave number 6 or 7 in zonal structure and is confined between 10° N and 50° N latitudes. It is seen from Fig.1, that the areas of southerly and northerly meridional wind anomaly of the WET composite above 200 hPa levels match with the same at 200 hPa and below. So the wave seen above 200 hPa level is an integral part of the APW reported by JS for 200 hPa and below. Amplitude of this wave decreases with height above 200 hPa and the wave is very weak above 70 hPa (figures not given).
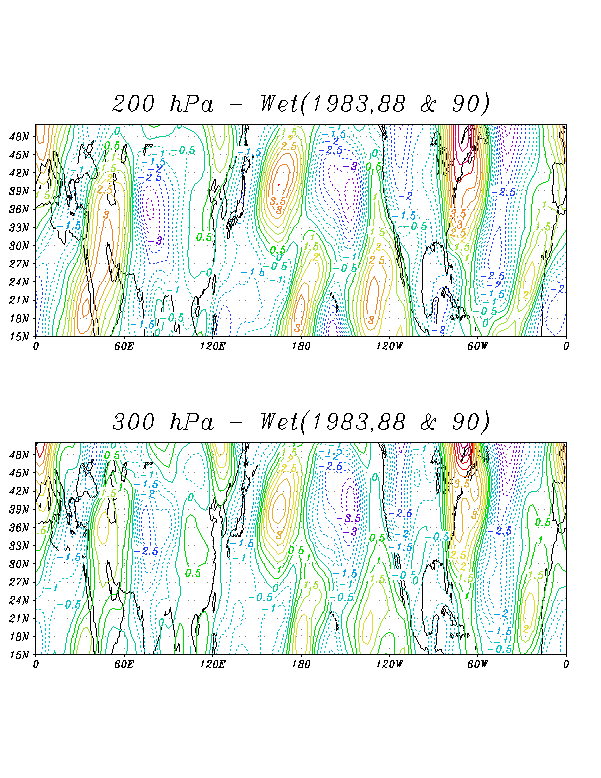
Figure 1(a-d) Meridional wind anomaly (m/s) of 70, 100, 200 & 300 hPa levels for WET ISMR composites
From Fig. 1(a-d), it is clear that the wave is present between 500 and 70 hPa levels with maximum amplitude around 200 hPa. Above and below 200 hPa, its amplitude decreases sharply. It is clear from this figure that the APW couples the upper troposphere and the lower stratosphere. Over the Indian region, northerly anomaly is seen during WET ISMR years and southerly anomaly is seen during DRY ISMR years. It is seen from the 200 hPa WET and DRY composites that the APW shows a phase shift of about 20° longitude between extreme ISMR years as reported by JS. JS showed that the APW at 200 hPa and below possesses major characteristics of stationary barotrophic Rossby Wave. The wave does not have phase shift with height. It is clear from Fig. 1(a-d), that the wave above 200 hPa level also does not show any phase shift with height.
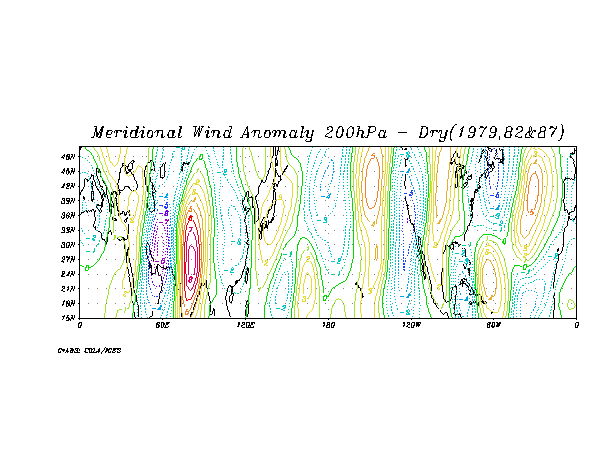
Figure 2 Meridional wind anomaly (m/s) of 200 hPa for DRY ISMR composite
APW and meridional mass
exchange
APW follows the subtropical westerly jet stream over Asian region and then moves southeastwards to the United States of America (JS). Although the wave shows north-south displacement in some regions, generally it is confined between 10°N and 50°N latitudes with large amplitude between 300 and 150 hPa levels. The latitude-height plot of the mean May temperature values of 1989 (normal ISMR year) averaged between 50-100° E longitudes (Indian region) for Northern Hemisphere is presented in Fig.3. The tropical tropopause is situated around 100 hPa and the subtropical tropopause between 200 and 300 hPa levels. Over 30°N and adjoining latitudes, tropical tropopause lies above the subtropical tropopause and a break region exist between them, which we call as tropopause break.
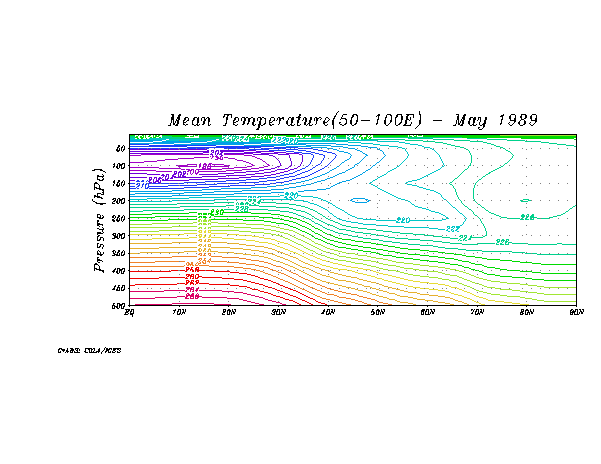
Figure 3 Latitude-Height plot of the temperature averaged between 50-100 E longitudes (Indian region) for May 1989.
Maximum amplitude of APW is in the tropopause break. It is likely that that the large amplitude meridional wind anomaly associated with APW is able to transport subtropical stratospheric air into tropical troposphere and vice versa effectively through the tropopause break region, which in turn can affect the total ozone distribution.
Asia Pacific Wave in
Total Ozone
In order to check the possible
presence of APW induced meridional mass exchange via the tropopause break,
we decided to examine the total ozone anomaly of May. Ozone is an ideal
tracer for this study because relatively long period satellite measured
total ozone data is available on global scale. Also ozone is relatively
abundant in the lower stratosphere. Subtropical stratospheric mass entering
the tropical troposphere may transport ozone rich air mass to relatively
ozone poor tropical region and increase the columnar ozone content over
this region. In contrast, tropical tropospheric mass entering subtropical
stratosphere may transport ozone poor air mass to this relatively ozone
rich stratospheric region and decrease the columnar ozone content over
this region. So it is easy to monitor the meridional mass exchange by analysing
the total ozone anomaly.
Gridded mean May TOMS total ozone data in the latitude range 0.5°N to 50.5°N for the period 1979-92 was available for analysis. Total ozone anomaly from the 14 year climatology is computed for May for each grid point. In Fig. 4(a-b), total ozone anomaly for the composites of WET and DRY monsoon years are presented. Areas of positive and negative total ozone anomalies are seen in the zone between 10°N and 50°N latitudes. It has a 6 or 7 wave number structure in the zonal direction just like APW. Areas of positive (negative) total ozone anomaly correspond to northerly (southerly) meridional wind anomaly of APW. Thus over north India in May of dry (wet) years there is negative (positive) anomaly in total ozone as may be seen from Fig. 4(a-b). In some regions, the areas of total ozone anomaly show small eastward shift while compared to the corresponding locations of the meridional wind anomaly. It is interesting to note that the Indian summer monsoon, which controls the spatial phase of the APW, is also associated with the total ozone distribution around the globe in the interannual time scale.
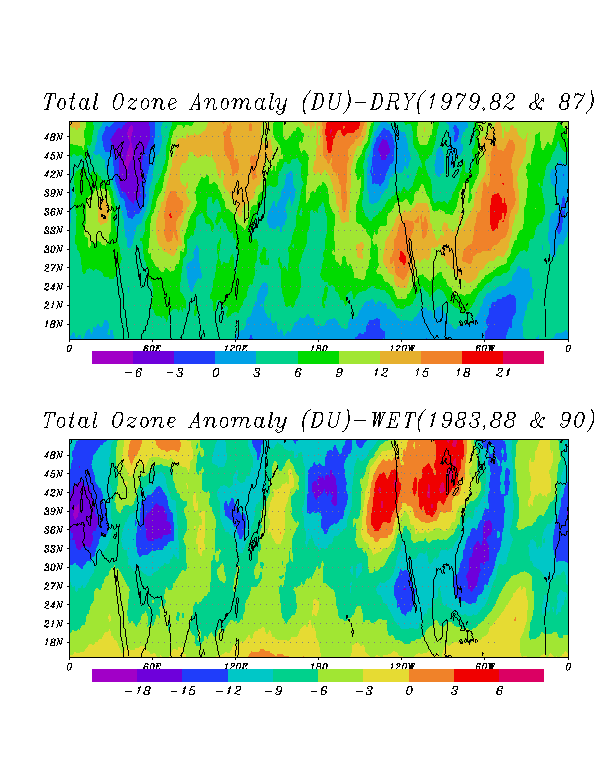
Figure 4 Total ozone anomaly (DU) for DRY and WET ISMR composites
Summary
Presence of a stationary wave train extending
from troposphere to the lower stratosphere is detected during the month
of May. This wave is prominently seen below 70 hPa level, has a zonal wave
number of 6 or 7 and is generally confined between 10°
N and 50°
N. In the lower stratosphere, the wave shows a phase shift of 20°
longitude between good and bad monsoon years. Amplitude of this wave is
maximum around 200 hPa and decreases both upward and downward. The large
amplitude portion of the wave is thus situated in the tropopause break
region between tropics and sub-tropics and is found to exchange tropical
and sub-tropical air masses through the tropopause break.
References
Holton et al, 1995: Rev. Geophy, 33, 403-439.
Joseph, P. V and J. Srinivasan, 1999: Tellus 51A, 854-864.
Kalnay, E et al, 1996, 1996: Bull. Amer. Met. Soc, 77, 437-471.
Parthasarathy, B et al, 1994: Theor. Appl. Climatol, 49, 217-224.
Stanford et al, 1995: NASA Ref. Pub, 1360.
Wirth, V and J. Egger, 1999: Quar. J. Roy. Met. Soc., 125, 635-655.
Back to
| Session 1 : Stratospheric Processes and their Role in Climate | Session 2 : Stratospheric Indicators of Climate Change |
| Session 3 : Modelling and Diagnosis of Stratospheric Effects on Climate | Session 4 : UV Observations and Modelling |
|
|
|
|
|
|