Previous: Introduction Next: Removal of Stratospheric NOy during the Antarctic Winter Up: Ext. Abst.
2. Experimental descent rates inferred from N2O, O3, and HNO3:
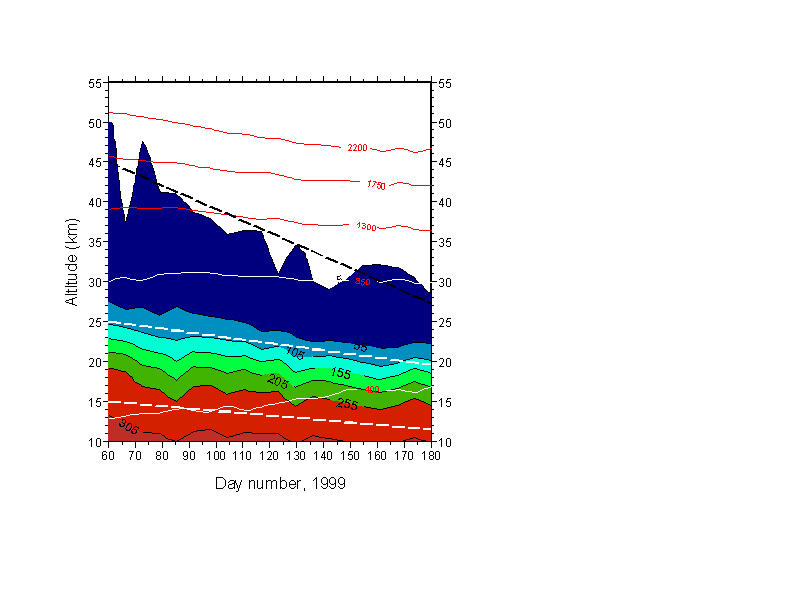
Starting with N2O as an inert tracer at lower altitudes, Fig. 1 shows that mixing ratio contours over the four month period from ~day 60 (March 1) to ~day 180 (June 29) of 1999 show remarkably constant descent in the range 10-25 km. Note that descent starts in the vortex well before sunset (~March 21 = day 80). The linear descent line starting at 45 km has been given the same final altitude as achieved on day 180 by the descent calculated by Rosenfield et al. [1994] during the same period. All other sample descent lines are deduced from the data only. Numerical equivalents are given in Table 1. The overall agreement is very good, although the "45 km" is merely the minimum detection level, and not a very secure day-by-day measurement. Note that the isentropic surfaces represented by constant potential temperature are in all cases cut by the diabatic descent indicated by mixing ratio contours.
Figure 1: Constant mixing ratio contours for N2O measured over the South Pole, from March 1 - June 29, 1999. Data from 1993 and 1995 displays very similar behavior. Sunset occurs at ground level on day 81. Fine lines indicate various potential temperature isopleths. Descent is clearly non-adiabatic. For simplicity, only linear descent rates are indicated from start to end of this period (heavy dashed lines). That starting at 45 km is drawn to exhibit only the total descent for this period calculated by Rosenfield, et al. [1994]. True descent is non-linear, and fastest at high altitudes. See text for further comments.
Fig. 2 shows ozone mixing ratio contours over days 60-180. During darkness, (> day 81) stratospheric ozone is nearly inert in the middle and upper stratosphere, yet the behavior appears markedly different from that of N2O, or the descent rates of Rosenfield et al [1994], shown as heavy dashed curved lines. Descent appears very weak , and seems to accelerate, rather than slowing, as air moves downward. The nominal linear descent lines (heavy white dashes) approximating the behavior of selected mixing ratio contours are much shallower in the upper stratosphere (e.g. starting at 50 km) and rather steeper in the middle stratosphere (e.g., starting at 35 km) than the theoretical descent rates. There appears to be no descent below ~17-18 km, again in contrast to the behavior of N2O.
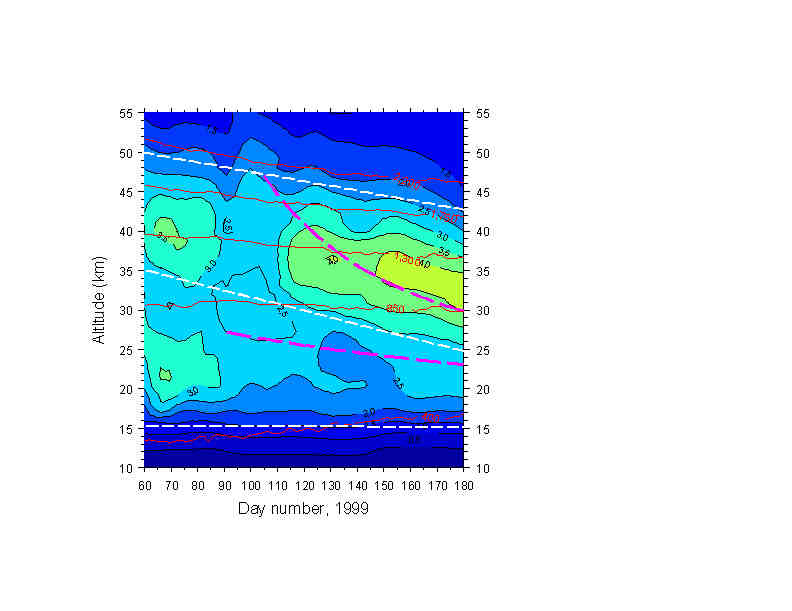
Figure 2: O3 contours for the same period, 1999, as Figure 1. Heavy curved dashed lines show descent rates from Rosenfield, et al., [1994], and are clearly not in agreement with descending O3 isopleths, which appear to show unphysically slow descent at high altitudes.
Fig. 3 shows mixing ratio contours for HNO3 for days 60-180. Note the change of vertical scale. No HNO3 data were taken over the blank period from days 107-117. HNO3 is photochemically active before sunset, and increases strongly in the weeks after sunset, at altitude-dependent rates, as NOx ® N2O5® HNO3. The surge of formation beginning after ~day 100 is eventually supplanted by rapid condensation, again altitude dependent, as HNO3 condenses into PSCs below 25 km, while new formation takes place above 25 km after ~day 150. Although this chemical activity should render HNO3 a very poor tracer, "descent" seems visible in the contour trends before and shortly following sunset, and for comparison I have indicated linear descent rates (heavy dashed lines) from selected altitudes equal to those determined from N2O, over days 60-100. It appears that during this period, downward transport still dominates the vertical distribution of HNO3. By contrast, the period ~day 120-140 shows no discernible downtrends in contours (sample lines at 30, 25, 20 km) as heterogeneous conversion of N2O5 and other altitude and time-dependent chemistry take control.
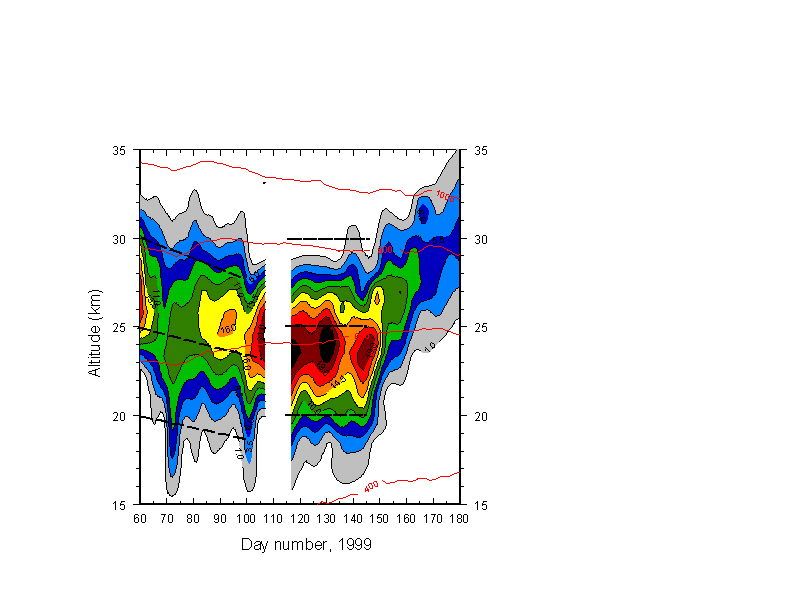
Figure 3: As in Figures 1 and 2, but for HNO3. Subjective indications for descent of mixing ratio isopleths has been divided into two segments. Prior to sunset HNO3 is in approximate photolytic equilibrium in the stratosphere. After sunset, HNO3 begins a rapid, altitude-dependent increase as NOy is shifted into HNO3. Days 120-145 show little if any indication of isopleth descent, in contrast with the inert tracer N2O (Fig. 1). After ~day 145, condensation rapidly removes HNO3 from the lower stratosphere, while new molecules form at higher altitudes.
Fig. 4 covers a somewhat later period, where the full range of HNO3 formation can be seen in the mid-to-upper stratosphere. Here, I have shifted to 1993 data, due to another unfortunate interruption of data-taking during this period in 1999. The heavy dashed black line again represent the descent calculations of Rosenfield et al. [1994] for the times and altitudes indicated. It looks persuasively like the descent marked by HNO3, (ignoring a probable dynamical event around day 200) if one traces the descent of the peak mixing ratio, rather than constant contours, realizing that an increasing amount of nitric acid is being formed via ion-cluster enhanced chemistry as vortex air continues to descend, with formation efficiency probably increasing when temperatures become cold enough for sulfate condensation at ~35-40 km [de Zafra and Smyshlyaev, in preparation, 2000]. (The empty region below 25 km has been cleared of gas-phase HNO3 by PSC formation. The upper boundary of this region descends faster than the calculated descent rate (not shown) after ~day 210 as the temperature boundary exceeding the PSC evaporation threshold descends and small or new PSCs, which have not yet gravitationally settled, evaporate and return HNO3 to the gas phase [McDonald et al., 2000].)
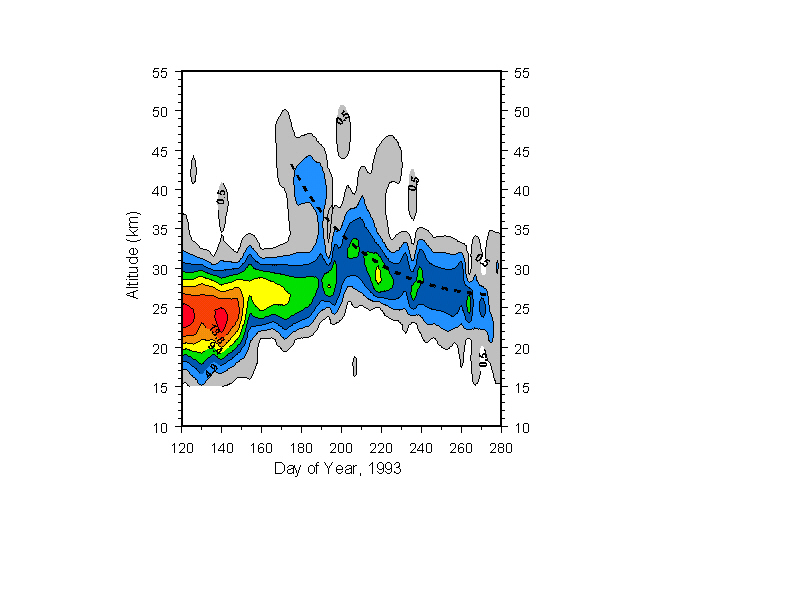
Figure 4: HNO3 for days 120-280, 1993. Formation of high-altitude HNO3 appears to be accompanied by rapid downward transport in general agreement with Rosenfield, et al. [1994], shown by the heavy dashed curve. HNO3 increases in mixing ratio as air is transported downward due to continued formation, so the track of peak mixiing ratio, rather than constant mixing ratio, is followed. See text.
Table 1 gives numerical estimates for overall linear descent rates inferred from descent of mixing ratio isopleths for N2O, O3, and HNO3, contrasted with the overall diabatic descent calculated by Rosenfield et al. [1994] for an isolated Antarctic vortex, also re-expressed as a linear rate. In reality, true air descent is of course faster at higher altitudes, and slows as descent progresses. The time period is between days 60 and 180 for N2O and O3, and between days 60 and 140 (to avoid the PSC condensation period) for HNO3, further divided into two sub-periods, as described above.
Agreement between N2O and Rosenfield et al. [1994] is surprisingly good for all altitudes covered except 20 km, where subsidence becomes somewhat uncertain. Agreement for O3 is, conversely, very poor. HNO3 is a separate case, due to its chemical activity both before and after sunset. Nevertheless, its descent from high altitudes in mid-winter (Fig. 4, graphed but not tabulated) appears to be in reasonable agreement with Rosenfield, et al. , as is the more speculatively determined descent over days 60-100
Why does upper stratospheric O3 appear to descend more slowly than mid-stratospheric O3, and in neither case approach agreement with theory, in contrast to N2O? Why does mid-to-upper stratospheric HNO3 appear to show a much more rapid descent than O3 within the same altitude range during mid to late winter, when both species, once formed, are supposed to be chemically inert in the winter darkness? Accepting the later premise, one must invoke a dynamical explanation [e.g., Backmeister et al., 1995, Strahan et al., 1996]. Different species may be expected to show different apparent descent rates if they have different mixing ratio gradients across the vortex boundary and if cross-boundary transport is significant. An extreme case is reached (Fig. 5) when considering species having opposite gradients, so that cross-boundary transport can act to decrease or increase the apparent rate of descent, depending on the sign of the gradient. The establishment of gradients, and their magnitudes, is time-dependent, however, so that the picture becomes more complicated -for instance, near the time when the vortex is gathering strength. In any event, one might expect to see significant contrasts in apparent vertical transport that depend, in fact, on the average cross-boundary transport relative to the rate of vortex descent, all of which typically varies with time.
|
|
|
|
O3 Apparent rate m/day |
|
|
|
50 45 40 |
n.a. 146 117 |
* (146) * |
58 ±16 - 63 ±17 |
* * * |
* * * |
|
|
|
|
|
|
|
|
|
|
|
|
|
|
|
|
|
|
|
|
|
|
|
|
|
|
|
|
|
|
|
|
|
|
|
† for days 60-95: values chosen to match N2O, as shown in Fig. 3
‡ for days 120-140.
n.a. = values not available.
( ) = speculative determination; descent line in Fig. 1 set to equal the model calculations.
[ ] = speculative determination; descent lines in Fig. 3 set to equal the N2O measurements.
* = mixing ratios too small to track accurately
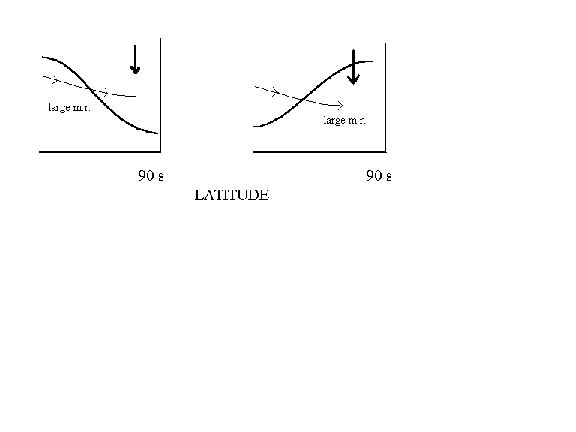
Figure 5: Schematic of a constant mixing ratio isopleth versus latitude (heavy curved line) for examples where gradient is negative (left panel) or positive (right) moving into the vortex. Cross-boundary air motion is shown by light line. Assume that mixing ratio decreases with altitude in the height range depicted. In the left panel, cross-boundary transport tends to sustain larger mixing ratios vs. altitude as air descends, making vertical descent appear slower than actual. The reverse is true for the right-hand panel.
Conclusions from Section 2. Different tracers (e.g., N2O, O3), even during times when thought to be chemically non-active, can give quite different apparent rates of downward transport at the core of the Antarctic winter vortex as well as nearer the vortex edge, for reasons associated with cross-boundary transport. A knowledge of cross-boundary tracer gradients, coupled with simultaneous apparent descent rates for several tracers, should give a better measure of mean cross-boundary transport (as a function of altitude and time) via the adjustment of transport equations to simultaneously satisfy the observed differences in apparent descent.