Previous: Methodological aspects Next: Conclusions Up: Ext. Abst.
3. The meteorological phenomenon and vulcanological activity.
3.1 Tropical cyclones and vulcanological eruptions.
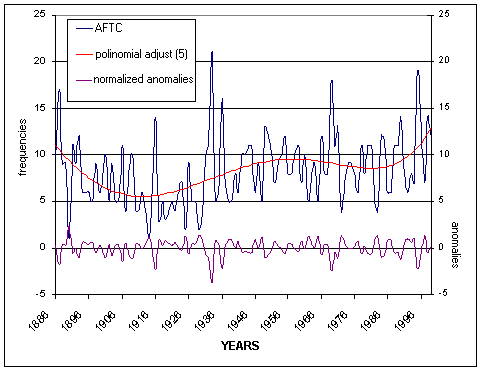
The adjusted curve of the AFTC according to the polynomial of fifth order explains of global form, the component recurrent and the tendency of the series of the TC. The analysis of Figure 1 (superior curve) permit us conjecture the existence of a general tendency to the increment of the cyclonic activity during the twenty century. At the same time, it models adequately the occurrence of the two periods of cyclonic activity decrease. One of them, situated around the decade of the ´10 and the other one, starting from that of the ´70, Aroche et al., and 2000. This allows presupposing that the occurrence of the absolute frequency extreme of 1933 is the result of a forcing for combined factors, inside which possibly this implicit an important perturbation in the own solar activity.

Figure 1: Adjusted curve of the AFTC according to the polynomial of fifth order. Anomalies (inferior curve)
In the same figure 1 (inferior curve), the results of the subtraction of the polinomial values, is sampled. That is to say the interference of the process of interest. (In which this subtraction has contrary sign).
In the sense of checking the representativity of different processes curves, it is relevant point out that, one test for independent samples was applied. It showed the existence of statistical significant differences, so much in the averages like in the variances of both series. In order to facilitate the analysis, the years were determined, for which differences were in several intervals of values (see Table 1).
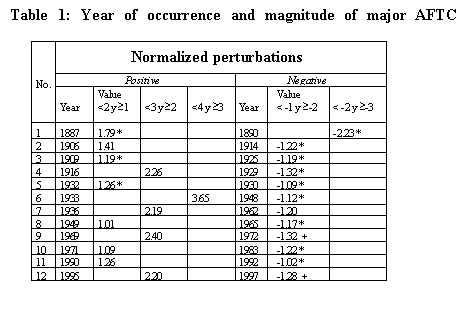
Those interference that have occurred in the same year (or to the maximum two years, hind to any of the EVE) are marked with asterisk (*) in Table 1, Aroche et al, 2000. Any EVE, that is not found in such paper, but that could have influence, not reflected through the VEI index, with (+) are marked too. With the help of which we inferred their possible relationship. Starting from this could know that the 75% of the negative interference could be explained for the occurrence of EVE, however only the 25% they of the positive seem to be associates with them. The sample formed by the interference, which have been generated for this eruptions, up to four years after their occurrence, with all they generated in the series for several factors, were compared. Significant difference was only obtained for them generated one year after them.
It is of noting in the Figure 2 that, the EVE of the tropical zone generates an important and stable descent in the frequency of the TC during about 2 or 3 posterior years to the eruption. Descent much old that the occasioned by the extratropical EVE, whose variable effects, also, are in opposite phase with regard to those of the tropical eruptions. Everything which, it could be sign of the difference of the mechanisms, through which, the same rebound on the climatic system.
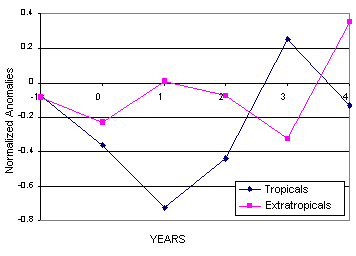
Figure 2: Variation AFTC associated with tropical and extratropical EVE occurence. According to superposed epoch method.
The produced changes, particularly, those starting from the 2.5 years after EVE, could be consider as results of the interferences of both types of eruptions. They are translated in a weakening of the final effects, which consequently, which move around the reestablishment of the normality in the behavior of the frequency of occurrence of the TC.
Nevertheless have obtained significant differences between the anomalies in the frequency of occurrence of TC, which have been determinate by superposed epoch, and all those generated by several factors according to of application of the test for independent samples, at least for a year after occurrence of the eruptions. The sign of the effects of such EVE, taking into account the semester of the year in which they occurred, was specified. The anomalies of AFTC of the season of the year of the eruption and that of subsequent year to the same were defined too. Was derived that 100% from the cases from EVE that occurred in the first semester, in the tropical band of both hemispheres, generated negative anomalies of the frequencies of the TC, in the cyclonic season of the same year and of similar manner happened with 6 of the second semester. Only that made it in the season of the following year, in the research region, with a contribution to its increase in the cyclonic activity of the season underway. So that, the volcanic eruptions that have taken place in said semester reduces the global impact what explains the fact that in the analysis of the previous epigraph the old impact has taken place in the year 1and not in the year 0.
When we carried out the analysis with regard to the EVE of the extratropical zone, the opposite was obtained. Although with less stability in the relationship, because the 66% of the eruptions of the first semester, they generated positive anomalies in the behavior of the TC, turning out to be indifferent when they are it of the second. With what it decreases the impact to the 62.5%. What expressed with a weaker impact of this type of eruptions with regard to the tropical how are accustomed to appreciate in the Figure 5.
What is discussed previously, it allow us to infer that in a study where were not separated the EVE, according to the latitude, the prevalence to the reduction of the frequency of the TC would be weakened. On the other hand, if don't keep in mind the semester of the year of EVE occurrence, would muffle the response in the formation of TC, in some cases, or it would amplify the negatives or positive in another.
3.2 Cold Fronts and volcanic eruptions.
Although in the Figure 3 is not observed the same degree of analogy between the curves of each graph, like her obtained for the TC we considered that the same exists, only limited for the minor longitude of the series of the CF. So that in the central interval of the series of CF, less affected for the implicit aliasing in the carried out procedure, is many more easy to observe. In this case it is conjectured an counterphase moving in the curves, of the order of 10 or 11 years, in the occurrence of their extreme values. If this regularity is being extrapolated, it would suggest that the beginning of the series of AFCF should be representative of a real minimal value and not a result of the sampling. It upon demanding a slight displacement of the adjusted curve downward, it would lead to the obtaining of relevant positive interferences during the period 1920-1930. This positive interference could be very well explained, keeping in mind the occurrence of the event ENSO, of great intensity of the 1925 to the 1926, whose effect of increment of the front activity is recognized (Portman and Gutzler, 1994, Cárdenas P and Naranjo L, 1999).
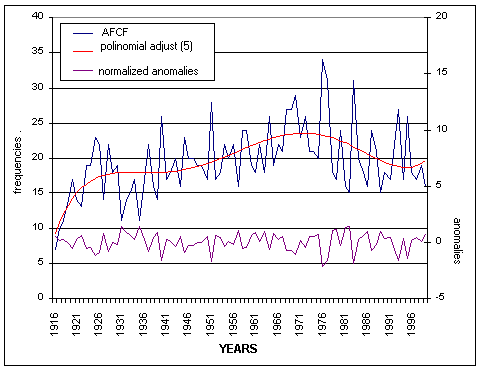
Figure 3: Adjusted curve of the AFCF according to the polynomial of fifth order. Anomalies.
The differences between the original data and the fittings of the series of CF (superior curves of the Figure 3), they will be considered as disturbances, and they will be treated of linking with forcing factors of the climate, and in particular case, with the EVE. Of similar way to describe for the TC, significant difference between the representative values of the perturbed and not perturbed states was obtained. In order to facilitate the analysis, the years were determined, for which happiness differences were in several intervals of values (see Table 2).
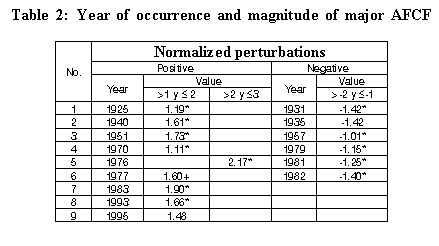
Starting from the information of the Table 2 one could determine that the 89% of the positive interferences and the 83% of the negatives are associated with the occurrence of EVE. Seemingly influencing of similar way so much in the generation of positive anomalies like negative. However it could be distinguished that the 66% of the positive is generated by EVE tropical. The same magnitude is explained in the negatives for the extratropical ones, which influence significantly and in particular in the same year of their occurrence.
In Figure 4 are shown the results of the application of the method of the superposed epoch]. In the same is of noting that the EVE of the tropical zone generates an important ascent in the frequency of the CF. It has place, particularly, during the same year of the eruption, when they cause the greater anomaly, which is during about 3 or 4 posterior years to the same, although of more and more weak way. However the extratropical ones, present a quick tendency toward positive values of the anomalies, but from a deep negative anomaly, generated in the same year of the eruption. It shows a sustained ascent, of general form, until the end of the period of analysis, whose effects are in opposite phase with regard to those of the tropical eruptions, but being, in a combined neutralized impact, or lightly negative, in the year of occurrence of the eruptions.
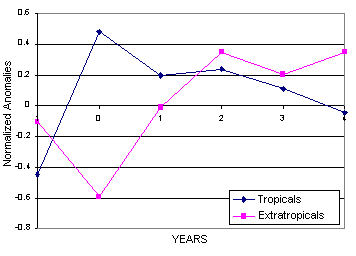
Figure 4: Variation AFCF associated with tropical and extratropical EVE occurence. According to superposed epoch method.
3.3 The Easterly Waves and volcanic eruptions.
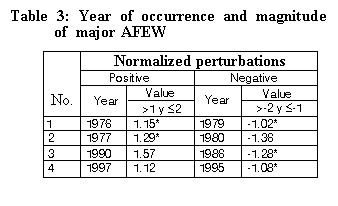
About the evolution of the original series and the adjusted (superior curves), as well as on the interferences (inferior curve), of the process of interest, is illustrated in the Figure5. The first show a good correspondence, with a reflection of certain periodicity (Aroche et al., 2000). The third curve reflects the existence of very low interferences, which they have been normalized with regard to the standard deviation of this series. In order to facilitate the analysis, the years were determined, for which happiness differences have place in several intervals of values (see Table 3).
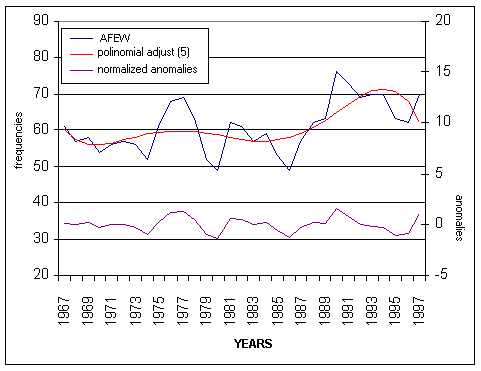
Figure 5: Adjusted curve of the AFEW according to the polynomial of fifth order. Anomalies (inferior curve)
In the Figure 6 are shown the results of the application of the method of the superposed epoch. It is of noticing that in spite of leaving of different conditions, as for values of the anomalies refer, the EVE of the tropical zone generates an important and stable descent in the frequency of the EW, particularly during about 2 or 3 posterior years to the eruption. While to the beginning (year of occurrence and hind to it) they sustain a previous positive anomaly to the event. However the extratropical EVE, in spite of sustaining the same previous to the event negative anomaly, tend to increase to the positive values, in opposite phase with the tropical EVE.
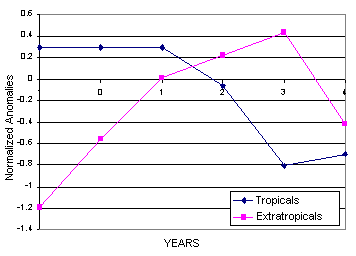
Figure 6: Variation AFEW associated with tropical and extratropical EVE occurence. According to superposed epoch method
In Table 3, we can see that the interferences don't reach the value corresponding to two standard deviations, and according to shown in the Figure 6, the normalized anomalies are predominantly negative, without overcoming 1.5 units. For these previously indicated reason it is reasonable conclude that this phenomenon is not very sensitive to the occurrence or not of EVE, but with a preferential response to diminish his annual frequency during their occurrence.
The absence of explanation of some anomalies, in the behavior of anyone of the studied meteorological systems, can be associated with the influence of other forcing factors of the climate. As good it can be the ENSO events, the variations of the solar activity, or the phase of the prevailing Quasibiennial Oscillation (QBO), during the influence of the stratospheric aerosols, originated by the EVE. Those aerosols seem to have a greater weight in the generation of the disturbances in the series of AFCF, since the meaning analysis of the differences between the alterations generated by the eruptions and the own of the original series threw negative results. It confirms upon taking into account some of these factors, as it is the sun, in the method of the disturbances as was referred previously.