>
Characteristics of gravity waves revealed in high-resolution radiosonde
observations at Pohang, Korea
In-Sun Song and Hye-Yeong Chun
Department of Atmospheric Sciences, Yonsei Univertisy, Seoul,
Korea
FIGURES
Abstract
1. Introduction
Vertically propagating gravity waves generated in the troposphere
can transport their momentum and energy into the middle atmosphere.
As gravity waves propagate vertically in the middle atmosphere,
they experience the increase of their amplitudes due to the density
decrease with the altitude. However, gravity wave saturation process
generates turbulence field so that the atmosphere can not be dynamically
or statically unstable due to the amplified gravity waves(Fritts
1984). Because gravity waves in the turbulence field can deposit
their momentum and energy to the large-scale flow, the gravity
waves can play an important role in the dynamics of the middle
atmosphere.
Lindzen (1981) theoretically investigated the interaction
between zonal mean flow and turbulence field induced by wave saturation,
and proposed a simple gravity wave parameterization scheme. Holton(1982)
numerically simulated the zonal mean wind to be changed by the
drag and diffusion of gravity wave with a specified phase speed.
Since such theoretical and numerical studies showed that the gravity
wave characteristic like phase speed distribution is essential
for the realistic simulation of the large-scale mean flow in the
middle atmosphere. There have been many attempts to observe several
gravity wave characteristics, for example wave energy, dominant
spatial and temporal scales of gravity waves, phase speed, propagation
direction, and anisotropy using radiosonde, rocketsonde, radar,
or lidar(e.g., Thompson 1978; Hirota and Niki 1985; Fritts et
al. 1988; Kitamura and Hirota 1989; Hamilton 1991; Allen and Vincent
1995; Vincent et al. 1997; Guest et al. 2000). Kitamura and Hirota
(1989) pointed out the importance of the subtropical jet as the
source of inertia-gravity wave through the latitudinal(
 N -
N -
 N ) distribution of inertia-gravity wave characteristics observed
by daily rawinsonde observation in the lower stratosphere. Allen
and Vincent (1995) investigated the latitudinal(
N ) distribution of inertia-gravity wave characteristics observed
by daily rawinsonde observation in the lower stratosphere. Allen
and Vincent (1995) investigated the latitudinal(
 S -
S -
 S ) and vertical( 2 - 24 km ) distribution of gravity wave activity
using sounding data observed at radiosonde stations of Austrian
Bureau of Meteorology. Guest et al. (2000) studied the properties
of inertia-gravity waves in the lower stratosphere, their seasonal
variation, and the likely source of the inertia-gravity waves
using high-resolution ozonesonde launched at Macquarie Island.
S ) and vertical( 2 - 24 km ) distribution of gravity wave activity
using sounding data observed at radiosonde stations of Austrian
Bureau of Meteorology. Guest et al. (2000) studied the properties
of inertia-gravity waves in the lower stratosphere, their seasonal
variation, and the likely source of the inertia-gravity waves
using high-resolution ozonesonde launched at Macquarie Island.
In this study, several gravity wave characteristics are investigated
using linear gravity wave theory and high-resolution rawinsonde
data observed in Pohang, Korea during a year of 1998. The seasonal
and vertical variations of the characteristics are also analyzed.
2. Observation and data analysis
We used sounding data observed by Vaisala Digicora2 MW 15
rawinsonde in Pohang(
 E,
E,
 N ), Korea during a year of 1998. The ascending rate of the balloon
is approximately 50 - 60
N ), Korea during a year of 1998. The ascending rate of the balloon
is approximately 50 - 60  , and all the observation variables are recorded every 10 second.
As a result, the vertical resolution of data is roughly 50 - 60
m. However, because the rawinsonde automatically smooth horizontal
wind data using low-pass filter in order to reduce observational
errors, the vertical resolution of horizontal wind data becomes
approximately 500 m. For the convenience, all observed variables
used in this study are interpolated into 50 m grids using cubic-splint
method.
, and all the observation variables are recorded every 10 second.
As a result, the vertical resolution of data is roughly 50 - 60
m. However, because the rawinsonde automatically smooth horizontal
wind data using low-pass filter in order to reduce observational
errors, the vertical resolution of horizontal wind data becomes
approximately 500 m. For the convenience, all observed variables
used in this study are interpolated into 50 m grids using cubic-splint
method.
Figure 1 shows time-height cross sections of monthly mean
temperature and zonal wind observed at Pohang. In this figure
we used sounding data that reached the higher altitude than 30
km. Temperature in the troposphere decreases rapidly with height,
while temperature in the stratosphere increases slowly with height.
The vertical lapse rate remains nearly constant in the stratosphere
regardless of the change of season. This suggests that the static
stability in the stratosphere is nearly constant during a year
of 1998. The jet stream in winter(January and December) are much
stronger than that in summer(July, August). Figure 1b also shows
the clear seasonal variation of zonal wind that the zonal wind
in the winter stratosphere is generally westerly, while that in
the summer stratosphere is easterly. However, it should be taken
note that easterly wind regions are also observed near z = 33
km in January and November.
Figure 1. Time-height cross sections of monthly mean (a) temperature and
(b) zonal wind. Contour intervals for temperature and zonal wind
are 5 K and 5 , respectively. The regions of easterly zonal wind are shaded
in (b).
![\includegraphics[scale=0.60]{fig01}](img15a.jpg)
|
For the analysis of gravity wave characteristics in the stratosphere
and the troposphere, the temperature and wind profiles within
17 - 30 km and 2 - 9 km altitude ranges are used, respectively.
The rapid changes of temperature and wind at the tropopause can
be excluded in the data analysis using the two separated analysis
regions. The sounding data observed at 00UTC and 12UTC are used
except for July in which there were only 7 soundings that reached
the higher altitude than 30 km at 00UTC and 12UTC. Accordingly,
in July, the sounding data observed at 06UTC and 18UTC are also
used in addition to 00UTC and 12UTC.
To obtain gravity wave perturbation from temperature and
wind profiles in the stratosphere and the troposphere, basic state
profiles are estimated by fitting second order polynomial into
sounding profile for individual variables, and perturbation profiles
are calculated by removing the basic state profile from the each
sounding profile.
3. Gravity wave characteristics
For the analysis of the seasonal variation of gravity wave
activity, monthly mean gravity wave energy densities,  and
and  , are calculated in the stratosphere and the troposphere. and are given by
where  and
and  can be derived using three-dimensional gravity wave spectrum
model suggested by Fritts and VanZandt (1993).
can be derived using three-dimensional gravity wave spectrum
model suggested by Fritts and VanZandt (1993).
Figure 2 shows time series of monthly mean and in the stratosphere and the troposphere. Although gravity wave
energy are derived in the vertically uniform basic state zonal wind
and static stability, the magnitude and tendency of  and in the stratosphere are almost the same. However, is quite different from in the troposphere. The similarity between and in the stratosphere suggests that the calculated perturbation
variables in the stratosphere can be referred to as gravity wave
perturbations.
and in the stratosphere are almost the same. However, is quite different from in the troposphere. The similarity between and in the stratosphere suggests that the calculated perturbation
variables in the stratosphere can be referred to as gravity wave
perturbations.
Figure 2. Time series of monthly mean and in (a) the stratosphere and (b) the troposphere. In each panel, and are plotted with solid and dash lines, respectively.
![\includegraphics[scale=0.60]{fig02}](img31a.jpg)
|
In the stratosphere, is much larger in January and November than in the other months.
The gravity wave activity in the stratosphere can be controlled
by the basic state flow and the characteristics of wave sources.
The stationary mountain waves can propagate vertically into the
stratosphere in winter because they do not meet critical level
for the zonal wind structure in the troposphere(Figure 1b). However,
those stationary waves can not propagate into the stratosphere
in summer because of the reversed zonal wind near the tropopause.
For the summer zonal wind structure, non-stationary waves induced
by convective storms may not propagate into the stratosphere,
either. Thus the strong wave activity in the winter stratosphere
can be determined by the combination of the above-mentioned wave
sources and basic state flow conditions.
In the atmosphere, there are many possible sources for gravity
waves besides mountain and convection. Kitamura and Hirota(1989)
showed the relevance of the subtropical jet to the wave activity
through the anaysis of the propagation direction of waves. Their
study suggests that the observed gravity waves in this study are
generated near the subtropical jet region far away form Pohang.
Accordingly, wave propagation characteristics should be estimated
in order to precisely analyze the strong gravity wave activity
in the winter stratosphere. However, the spectral characteristics
and dominant spatial and temporal scales of gravity wave should
be calculated in advance in order to estimate wave propagation
characteristics.
In this study, we calculated the power spectral densities
of the normalized temperature as a function of the vertical wavenumber.
Allen and Vincent (1995) fitted their model spectra into the monthly
mean PSD to obtain several spectral characteristics of gravity
waves. The model spectra used in Allen and Vincent is given by
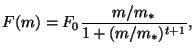 |
(3) |
where  is vertical wavenumber(
 ),
),  is the characteristic vertical wavenumber(
 ), and
  is the log-scale spectral slope in the large vertical wavenumber
region.
is the log-scale spectral slope in the large vertical wavenumber
region.
The characteristic vertical wavenumber() indicates the dominant vertical scale in the observed gravity
wave field because the gravity wave energy is concentrated near
the vertical scale corresponding to in the area-preserving form of PSD(not shown). Yearly mean s are  (4.37 km) and
  (3.92 km) in the stratosphere and the troposphere, respectively.
The spectral slopes() of monthly mean PSDs in the large vertical wavenumber region
are slightly less than -3 except for the stratospheric PSD in
May, July, and August. Yearly mean are 2.66 and 2.86 in the stratosphere and the troposphere, respectively.
(3.92 km) in the stratosphere and the troposphere, respectively.
The spectral slopes() of monthly mean PSDs in the large vertical wavenumber region
are slightly less than -3 except for the stratospheric PSD in
May, July, and August. Yearly mean are 2.66 and 2.86 in the stratosphere and the troposphere, respectively.
The intrinsic frequency and mean propagation direction of
the wave are estimated using Stoke's parameter method(Eckermann
and Vincent 1989) and Hilbert transform, and mean horizontal and
vertical wavenumber are obtained assuming that the observed perturbation
variables are due to inertia gravity waves. The monthly mean vertical
wave lengths are about 2.94 km and 2.55 km in the stratosphere
and the troposphere, respectively. The estimated monthly mean
horizontal wave lengths are about 430.94 km and 96.59 km in the
stratosphere and the troposphere, respectively. Thus it can be
immediately seen that the horizontal scales of waves are, on average,
200 times as large as the vertical scales of waves in the stratosphere.
The ratio of intrinsic frequency to inertia frequency (
 ) are about 2.26 with small seasonal variations in the stratosphere.
The intrinsic phase speed and group velocity are written as
) are about 2.26 with small seasonal variations in the stratosphere.
The intrinsic phase speed and group velocity are written as
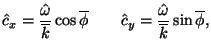 |
(4) |
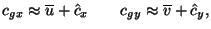 |
(5) |
where
 is the intrinsic frequency,
 is mean horizontal wavenumber, and
 is mean propagation direction.
Figure 3 shows the intrinsic phase velocity and group velocity
vectors in the stratosphere in January and July. In the stratosphere,
the mean direction of intrinsic phase velocities in winter is
mainly toward the northwest, while that in summer is toward the
northeast. That is, the observed gravity waves in the stratosphere
have the anisotropic propagation characteristics. The monthly
mean
 s in the stratosphere show an interesting seasonal variation that
there exist the negative in winter, and positive in summer. In the troposphere, however,
the propagation characteristics do not have the anisotropy that
exists in the stratosphere.
s in the stratosphere show an interesting seasonal variation that
there exist the negative in winter, and positive in summer. In the troposphere, however,
the propagation characteristics do not have the anisotropy that
exists in the stratosphere.
Figure 3. The intrinsic phase velocity and group velocity vectors in the
stratosphere in January and July.
![\includegraphics[scale=0.60]{fig04}](img56.jpg)
|
The monthly mean  shows the seasonal variation opposite to that of
in the stratosphere. Thus we can see that the basic state wind
significantly affects the dominant direction toward which the
gravity wave energy propagates.
shows the seasonal variation opposite to that of
in the stratosphere. Thus we can see that the basic state wind
significantly affects the dominant direction toward which the
gravity wave energy propagates.
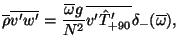
In this study, because  is not directly observed, the zonal and meridional momentum fluxes
are indirectly estimated in order to examine the interaction between
the observed gravity waves and the large-scale circulation. the
zonal and meridional momentum fluxes are calculated using
is not directly observed, the zonal and meridional momentum fluxes
are indirectly estimated in order to examine the interaction between
the observed gravity waves and the large-scale circulation. the
zonal and meridional momentum fluxes are calculated using
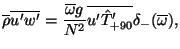 |
(6) |
 |
(7) |
where
 is the spectral average value,
 is the Hilber transformed normalized temperature perturbation,
and
is the Hilber transformed normalized temperature perturbation,
and
 .
.
From the monthly mean zonal and meridional momentum flux
in the stratosphere, we can see a clear seasonal variation of
zonal momentum flux. In the stratosphere, zonal momentum is transported
downward in winter, while that is transported upward in summer.
Because the intrinsic phase velocities in the winter stratosphere
are mainly westward, the downward trasfer of the zonal momentum
should be observed for the gravity waves that propagate their
energy upward. Thus it is expected that the gravity waves will
deposit their negative momentum to the large-scale flow, and accelerate
the large-scale zonal flow westward in the region where the diffusion
or breaking of the gravity waves exist. As a result, the easterly
zonal mean flow in the winter stratosphere in January and November
may be due to the deposition of gravity wave momentum to the large-scale
zonal flow. Non-zero vertical gradient of zonal and meridional
momentum flux in January and November can be clearly seen in the
vertical profiles of monthly mean zonal and meridional momentum
fluxes in the stratosphere. In January, the magnitude of the zonal
momentum flux above z = 20.5 km decreases with the altitude, and
approaches to zero above z = 28 km. In November, the magnitude
of zonal momentum flux decrease rapidly with height in the altitude
range between z = 19.5 km and 22 km. This vertical structure of
the zonal momentum flux in the winter stratosphere indicates that
the gravity waves can accelerate the large-scale zonal wind westward.
4. Summary
We investigated the characteristics of gravity waves using
the high-resolution rawinsonde data made at Pohang, Korea during
a year of 1998.
The seasonal gravity wave activities were examined though
the calculation of mean gravity wave energy densities, and . was directly calculated from the observed perturbation. while was estimated assuming the observed perturbations to be due to
the gravity waves. In the stratosphere, and were almost the same in their magnitude and seasonal variation.
This similarity suggests that the calculated perturbation variables
in the stratosphere can be considered to be due to gravity waves.
The strong gravity wave activity in the stratosphere appeared
in January and November. Because the gravity wave activity depends
on wave sources and mean flow conditions, further information
on the wave sources was needed. In this study, the characteristics
of wave sources were estimated through the caculation of the group
velocity  and intrinsic phase velocity
 .
.
Through the nonlinear fitting, we can estimate spatial scales
of gravity wave. The vertical gravity wave scales of 4.37 km
and 3.92 km were dominant in the stratosphere and the troposphere,
respectively. The spectral slopes were slightly less than -3 except
for the stratospheric PSD in May, July, and August, and the spectral
slopes in the stratosphere were usually less than those in the
troposphere.
Mean intrinsic frequencies(
 ) of gravity waves were calculated using Stoke's parameter methods.
In the stratosphere, the calculated
s were about 2.26 times as large as the inertial frequency at
Pohang, Korea, and any significant seasonal variation of
was not found.
) of gravity waves were calculated using Stoke's parameter methods.
In the stratosphere, the calculated
s were about 2.26 times as large as the inertial frequency at
Pohang, Korea, and any significant seasonal variation of
was not found.
Mean horizontal scale of gravity waves was estimated using
the dispersion relation for the inertia gravity waves, mean vertical
wavelength in PSD, and the estimated intrinsic frequency. The
aspect ratio of horizonal scale to vertial scale of gravity waves
was about 200 in the stratosphere. This indicates that the observed
wave motion is almost horizontal. That is, the large portion of
wave energies can be explained by horizontal kinetic energy.
The intrinsic phase velocities showed a clear seasonal variation
in the stratosphere. Westward propagation was dominant in winter,
while there exist a weak eastward progation in summer. For the
gravity waves propagating their energy upward, such a anisotropy
of the wave propagation in the stratosphere suggests that the
downward and upward transfer of zonal momentum will be observed
in winter and summer, respectively. As we expected, The momentum
flux estimated in this study showed the seasonal variation similar
to that of the intrinsic phase velocity. The significant vertical
gradient of zonal momentum flux was seen in the stratosphere in
January and November when the and were much stronger compared to those in the other months. Thus
the revesal of zonal wind near z = 33 km in January and November
is thought to be greatly associated with the activity of gravity
waves and the vertical structure of zonal momentum flux.
5. References
Allen, S. J., and R. A. Vincent, 1995: Gravity wave activity in
the lower atmosphere: Seasonal and latitudinal variations. J. Geophys. Res.,100, 1327-1350.
Eckermann, S. D., and R. A. Vincent, 1989: Falling sphere observations
of anisotropic gravity wave motions in the upper stratosphere
over Australia. Pure Appl. Geophys., 130, 509-532.
Fritts, D. C., 1984: Gravity wave saturation in the middle atmosphere:
A review of theory and observations. Rev. Geophys. Space Phys.,22, 275-308.
Fritts, D. C., T. Tsuda, T. Sato, S. Fukao, and S. Kato, 1988:
Observational evidence of a saturated gravity wave spectrum in
the troposphere and lower stratosphere. J. Atmos. Sci., 45, 1741-1759.
Fritts, D. C., and T. E. VanZandt, 1993: Spectral estimates of
gravity wave energy and momentum fluxes. Part I: Energy dissipation,
acceleration, and constraints. J. Atmos. Sci., 50, 3685-3694.
Guest, F. M., M. J. Reeder, C. J. Marks, and D. J. Karoly, 2000:
Inertia-gravity waves obsered in the lower stratosphere over Macquarie
island. J. Atmos. Sci., 57, 737-752.
Hamilton, K., 1991: Climatological statistics of stratospheric
inertia-gravity waves deduced from historical rocketsonde wind
and temperature data. J. Geophys. Res., 96, 20831-20839.
Hirota, I., and Niki T., 1985: A statistical study of inertia-gravity
waves in the middle atmosphere. J. Meteor. Soc. Japan, 63, 1055-1066.
Holton, J. R., 1982: The role of gravity wave induced drag and
diffusion in the momentum budget of the mesosphere. J. Atmos. Sci., 39, 791-799.
Kitamura, Y., and I. Hirota, 1989: Small-scale disturbances in
the lower stratosphere revealed by daily rawin sonde observations. J. Meteor. Soc. Japan, 67, 817-831.
Lindzen, R. S., 1981: Turbulence and stress owing to gravity wave
and tidal breakdown. J. Geophys. Res., 86, 9707-9714.
Thompson, R. O. R. Y., 1978: Observation of inertial waves in
the stratosphere. Quart. J. Roy. Meteor. Soc., 104, 691-698.
Vincent, R. A., S. J. Allen, and S. D. Eckermann, 1997: Gravity
wave parameters in the lower stratosphere. Gravity Wave Processes: Their Parameterization in Global Climate
Models Springer-Verlag, 404pp.
Back to
![$\displaystyle \frac{1}{2} \left[ \overline{u'^2} + \overline{v'^2} + \frac{ g^2}{N^2} \overline{ \bigg(\frac{T'}{\overline{T} } \bigg)^2 } \right] ,$](img21.jpg)