Department of Physics, University of Wales, Aberystwyth, UK
Gravity waves in the atmosphere can be generated by deep convection as well as by orography. High resolution radiosonde data form the basis of a study to find whether convectively generated gravity waves are energetically important in the midlatitudes.
Several years of data from stations in the UK are used. Convective available potential energy (CAPE) is used as an indicator of the likely occurrence of deep convection. Gravity waves are detected through their effect on the ascent rate of radiosondes (typical vertical velocity perturbations are 1 ms-1) and by examining the hodograph (u-v diagram) using the Stokes parameter technique for finding the polarization properties. Cases of correspondence between high values of CAPE and the existence of waves in the stratosphere are described. Shear is determined for the ascents. In the resulting climatology it is found that high values of CAPE occur in about 10% of all the gravity wave cases in the radiosonde ascents.
The energy content of gravity waves is determined using a spectral analysis. Using the total data set it is found that the energy content of gravity waves on average is NOT as important during convection as during strong shear events. This can also be seen in the associated calculations of the momentum transfer.
These two results suggest that convectively generated gravity waves represent a physical process in the midlatitudes that should not be neglected.
For the spectral analysis the high resolution radiosonde data was analysed following the work of Allen and Vincent (1995) and Vincent et. al. (1997). Climatologies of energy and of direction of propagation in both the horizontal and vertical directions which can be determined from high resolution radiosonde data are a valuable tool to do this.
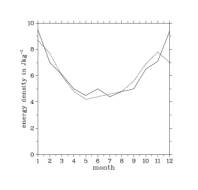
Figure 1 : Energy density for high CAPE cases (solid) and low CAPE cases
(dashed), for the total ascents for Camborne from 1990-1996 and
for high (solid) and low (dashed) shear cases.
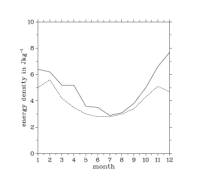
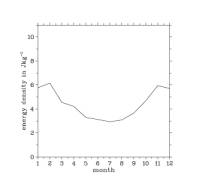
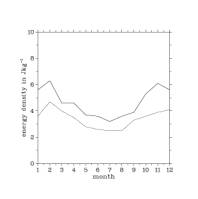
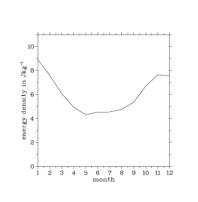
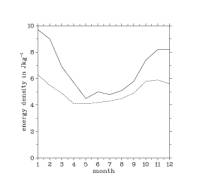
Figure 2 : Energy density for high CAPE cases (solid) and low CAPE cases
(dashed), for the total ascents for Camborne from 1990-1996 and
for high (solid) and low (dashed) shear cases.
Criteria for inertial gravity waves, gravity waves, shear and convection were developed to automate the analysis of radiosonde ascent data. Relationships of the different criteria to each othere were considered. Positive identification of shear as an inertial gravity wave generation mechanism is possible if the origin of the waves is indicated by the Stokes parameter method and when Stokes parameters indicate a rotation direction of the wind velocity vector opposite for the troposphere and the stratosphere. If there are waves travelling away from a jet then shear can be related to inertial gravity waves in the climatology. Positive identification of shear as a generator of gravity waves is more difficult. Many of the case studies indicate the presence of shear in conjunction with CAPE. In this case, the relative importance of the two effects is difficult to measure. For this reason, the climatological study of the following section includes the analysis of the subsets of data where CAPE and shear are mutually exclusive.
Necessary conditions for the identification of convection as dominant wave generation mechanism are an unstable troposphere where there is a potential for convection to happen. A method to do this is using the CAPE. Also there must be stable regions present in the atmosphere where gravity waves can develop. Since moderate convection exist in a great number of ascents there will be cases where this condition is fulfilled. If cases of gravity waves are detected and a high or moderate CAPE and the other wave generating mechanisms can be excluded then there is a high probability that these waves are caused by convection. However, other mechanisms often cannot be excluded, as has been found in case studies (not shown here).
A thunderstorm case study has shown that there is a link between CAPE and convection. Here the thunderstorm case was identified independently using sferics and a high level of CAPE detected simultaneously. Much more work has to be done to quantify this link. However the case studies have indicated an intrinsic problem with an automated climatology based on radiosonde ascents: the lack of an indicator to exclude orography or synoptic scale wave generation.
TG shows when the atmosphere can support waves but does not explain the cause. With the TG analysis, stationary waves are indicated if solutions with the observed wavelength exist. Stationary waves must be orographic as long as any convection or other generation mechanism did not produce stationary waves. Convective sources of stationary waves are possible as is suggested by the thunderstorm case. It is however not possible to apply the TG analysis to over 30000 profiles since it requires manual interpretation and can therefore only be used for individual cases.
An important wave generation mechanism, orography, cannot be identified automatically for the climatology. Therefore it has to be remembered that the wave cases may include orographically generated waves.
For the spectral analysis of the radiosonde data the results for the determination of the different criteria have been used to produce the energy density plots.
Atmospheric waves have many generation mechanisms. Shear and convection are amongst many others like mountains, turbulence fronts or geostrophic adjustment. In this chapter techniques have been described to indicate the existence of both gravity and inertial gravity waves and different wave generating mechanisms in radiosonde ascents. The association of wave generating mechanisms with gravity waves from radiosonde ascents is a very difficult task due to noise in the data and the uncertainty in the mechanisms.
These techniques have been combined in a new algorithm which allows an automated analysis of wave events. A significant innovation is the use of the Stokes parameter method. The Stokes parameter spectrum has been developed for the use in single ascents and was used here to routinely find inertial gravity waves in radiosonde ascents.
35261 profiles were used for the analysis. Chi-square analysis introduced significance to the indicators and a method has used to describe associations between those indicators.
The results of the climatological analysis are illuminating. Most important of these results are
For the interpretation of the above results the following uncertainties must be borne in mind:
These points may lead to an underestimate of convection.
Despite these uncertainties, the study gives important new information about the incidence of gravity waves in the UK, and their relationship with local environmental factors. The indication from this study is that convection may play an important role in gravity wave production even in the mid-latitude winter.
S. J. Allen and R. A. Vincent (1995) Gravity wave activity in the lower atmosphere: seasonal and latitudinal variations, Journal of Geophysical Research 100(D1):1327-1350
R. A. Vincent, S. J. Allen and S. D. Eckermann (1997) Gravity wave parameters in the lower stratosphere in Gravity wave processes, Springer-Verlag, ed. K. Hamilton, pp 7-26
Back to
| Session 1 : Stratospheric Processes and their Role in Climate | Session 2 : Stratospheric Indicators of Climate Change |
| Session 3 : Modelling and Diagnosis of Stratospheric Effects on Climate | Session 4 : UV Observations and Modelling |
| AuthorData | |
| Home Page | |