Royal Netherlands Meteorological Institute, PO Box 201, 3730 AE
De Bilt, The Netherlands.
mailto:weelevm@knmi.nl, mailto:fortuin@knmi.nl, mailto:kelder@knmi.nl
FIGURES
Abstract
One year of spectral UV observations at Paramaribo, Suriname are analysed. The data have been compared with radiative transfer (RT) model calculations and with ozone column measurements. Specific features are discussed that modulate the UV insolation at this site over the year. Specifically these include the annual cycles in solar zenith angle and total ozone column, the Sun-Earth distance and the effect of clouds and aerosols. The UV insolation at Paramaribo is found to be surprisingly constant.
Introduction
Since March 1999 spectral UV observations at Paramaribo, Suriname are performed with a Brewer MKIII double spectrophotometer. Currently one year of data has been analysed and compared with radiative transfer (RT) model calculations and with ozone column measurements.
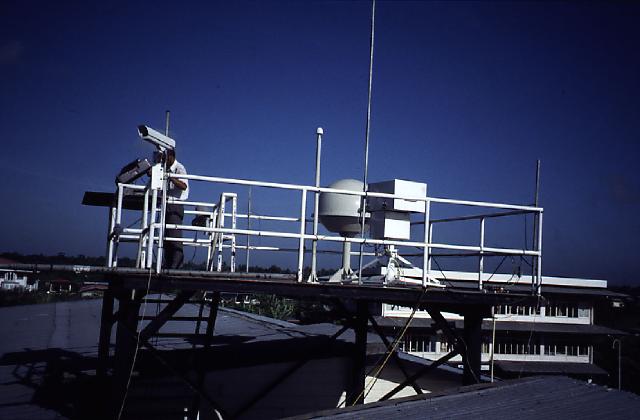
Figure 1. The picture shows the Brewer #159 on the right side of the platform at the roof of the MDS. The site is at sea level and has a 360 degrees free horizon.
Site Description
The measurement site is situated at the Suriname Meteorological Service (MDS) in Paramaribo (5.8N;55.2W), the capital of Suriname. UV spectra (290-363 nm; 0.5 nm steps) are recorded up to 20 times a day, and alternate with the Brewer ozone measurements. Once a week an ozone sonde is launched from the site. A webcam records the sky above the measurement site to detect cloudiness. Absolute response, wavelength and ozone calibrations have been performed in March 1999 and in April 2000. The instrument performance is checked daily.
Comparison with RT Model Calculations
The UV spectra have been checked extensively against accurate discrete-ordinate RT model calculations for their stability, wavelength alignment and overall consistency. Therefore, the absolute measurements are divided by a solar spectrum (Atlas-3), which has been convoluted with the Brewer slit width. This is the 'observed atmospheric transmission', which is compared with a modeled transmission. In the model calculations we use the measured Brewer ozone column. The aerosol extinction in the model is very low: 0.09 at 320 nm. Figure 2 shows five 'observed transmission' spectra on 17 September 1999, which was an almost cloud-free day. The measured ozone column was 281 DU with little diurnal variation. In red are the model calculations. Very good agreement is found. A difference plot is given for the noon spectrum to show that deviations are within 10\% for this case. The good agreement also indicates that the assumption of low aerosol load is valid on this day. The advantage of the applied comparison method between measurements and model calculations is that unexpected deviations can easily be detected and the causes investigated. For example, the last spectrum shows the effect of a passing cloud. The sun just returned on the instrument before the spectrum was fully recorded.
Figure 2. Comparison of five measured transmission spectra (black) with RT model calculations (red) for 17 September 1999. The figure in the middle on the right shows the relative differences that correspond with the figure on the left (both at 15h21 UT which is about local noontime).
Annual Variation
The annual variation in UV insolation at Paramaribo is modulated by the variation in solar zenith angle (sza), Sun-Earth distance, ozone column and cloudiness. At Paramaribo the sun crosses the zenith at local noon twice a year: in April and September (Figure C). The difference in UV insolation between both cycles is partly compensated by the Sun-Earth distance which is smallest in January and yields about 6\% more UV in January than in July. The bimodal distribution due to the variations in sza is partly compensated by the annual cycle in the ozone column: the maximum ozone column in September coincides with the minimum sza. The scattered UV measurements show that a cloud-free noontime is the exception at Paramaribo, even in the dry seasons (Feb-Mar;Aug-Nov). The maximum UV Index measured in Paramaribo thus far is 17.5 on 4th of April 1999, in partly cloudy conditions.
Figure 3. One year (1 Apr 1999 - 1 Apr 2000) of UV Index (top) and total ozone (bottom) measurements at Paramaribo. The figure in the middle gives the solar zenith angles of the spectrum for which the UV Index was determined, which is the first spectrum after noontime on each day. For comparison, in red, in the top figure, the UV Index is given as calculated with a regression method based on total ozone and sza as applicable at mid-latitudes.
Conclusions
The UV insolation at Paramaribo is surprisingly constant over the year with typical maxima of UV Index of 13 or 14 on a cloudfree day. The UV Index as calculated with a regression method based on the ozone column and sza as applicable in mid-latitudes (AES, Ontario, Canada; Burrows et al., 1994) is systematically smaller than the observed UV Index. Different regression models are needed for the UV Index-Total ozone relationship for different latitude bands and/or sites.
References
Burrows, W.R., Vallee, M., Wardle, D.I., Wilson, L.J., and D.W. Tarasick, 1994,Met. Appl., 1, 247-265.
Fortuin, J.P.F., H.M. Kelder and C. Becker, 2000, Paramaribo station:
analyses of new atmospheric observations in Suriname, this Proceedings
issue.
Back to
| Session 1 : Stratospheric Processes and their Role in Climate | Session 2 : Stratospheric Indicators of Climate Change |
| Session 3 : Modelling and Diagnosis of Stratospheric Effects on Climate | Session 4 : UV Observations and Modelling |
| AuthorData | |
| Home Page | |