Royal Netherlands Meteorological Institute, PO Box 201, 3730 AE
De Bilt, The Netherlands.
(mailto: fortuin@knmi.nl , mailto:kelder@knmi.nl)
Meteorological Service of Suriname, Magnesiumstraat 41, Paramaribo,
Suriname
(mailto:cbecker@sr.net)
FIGURES
Abstract
First analyses of a new observation program at Paramaribo station
(5.8° N, 55.2° W) are presented. The effect of the migrating Sun
and ITCZ over Suriname is discussed, as well as the role of the
Brewer-Dobson circulation and the Madden Julian Oscillation. Attention
is further given to the depth of the convective layer over Suriname
and to evidence of inter-hemispheric transport.
Introduction
Under the project RADChiS (Research on Atmospheric Dynamics and
Chemistry in Suriname, funded 1998-2002) an observation site was
established in Paramaribo, Suriname, measuring:
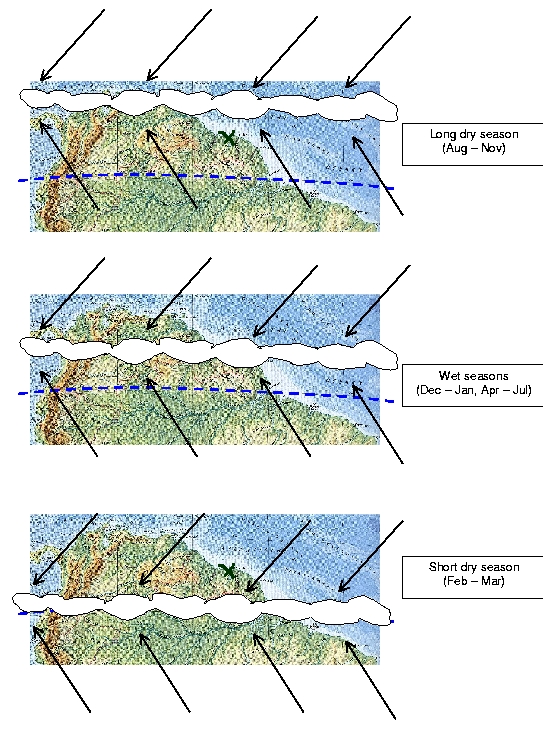
Paramaribo station (5.8° N 55.2° W) lies at the north-coast of
South America, about in the middle of the latitudinal migration
range of the ITCZ in this region (cf. Figure 1). Hence, air from
the Northern/Southern Hemisphere is sampled here, respectively
during the short/long dry season (Feb-Mar/Sep-Nov), as well as
air within and around the ITCZ, during the two rainy seasons (Dec-Jan
and Apr-Jul).
Figure 1. The position of Paramaribo station (indicated with a cross) with respect to the Equator (blue dotted line) and the migrating ITCZ (cloudy band).
Results
Figure 2 (top) shows 1.5 years (starting March 1999) of Brewer total ozone values, along with sonde humidity and meridional wind measured at 1 km height. The wet seasons occur in the transition zone where the meridional wind direction changes sign (see also Figure 3, bottom), and the ITCZ migrates overhead. Maximum total ozone values are reached when the Sun is at zenith during the long dry season, indicating that photolysis of oxygen in the stratosphere contributes significantly to total ozone. Also noticeable from Figure 2 is that the ozone maximum in 2000 is about 10 DU less than the 1999 ozone maximum. This is most likely due to the descending easterly phase in the QBO (cf. Fig. 3, top), which induces a mean ascending motion [Plumb and Bell, 1982] that transports low ozone values from below upward.
This argument also explains in principle the total ozone minimum occurring during Northern Hemisphere winter, when the Brewer-Dobson circulation and hence ascent of air is most intense, hereby causing minimum tropopause temperatures as well (cf. Figure 2, bottom). This period further coincides with the ITCZ passing overhead during the short wet season (Dec-Jan). However, the second passing over of the ITCZ during the long wet season (Apr-Jul) shows no clear effect on total ozone and tropopause temperature, which means that these parameters are less influenced by processes within the ITCZ (e.g., increased convection, cloudiness and rain) than by the intensified Brewer-Dobson circulation.
From figure 2 (bottom), an oscillation with a period of 30 to
50 days is apparent in the temperature and zonal wind at the tropopause.
This is quite in agreeement with the Madden-Julian oscillation
[Madden and Julian, 1972], and can be attributed to periodic intensified
deep convection over the equatorial Indian Ocean, the effects
of which propagate eastward. Also humidity in the lower troposphere,
and as it seems total ozone, shows modulation by the MJO.


Figure 2. Top: Brewer total ozone (red) and meridional wind (green, southerly positive) plus % humidity (blue, range 0-100%) at 1 km height, versus Julian day. Rainy seasons (typical) and solar zenith angle minima are indicated (resp. shaded blue, yellow circles). Bottom: Total ozone (red, same scale as Fig. A), and zonal wind (green, westerly positive), temperature (orange) at 17 km. Humidity at 3 km height (blue, scale 0-100%). Period: March 1999 - October 2000.
Figure 3 (top) shows the QBO at the end of its Westerly phase. Also apparent are wave-like structures in the upper troposphere. Apart from a relation with MJO, first studies indicate these waves are generated at the top of the convective layer, somewhere between 10-15 km, coinciding with a level of sudden rise in potential temperature. On average, convection does not seem to penetrate much higher than this, as is confirmed by calculations of the equivalent potential temperature (cf. Fig. 4, top), with latent heat release from both condensation and freezing taken into account. Clearly, surface values of equivalent potential temperatureare similar to those at 10-14 km. However, this does not take into account buoyancy momentum, and peaks in the tropopause height (not shown here) might indicate events of deep convective penetration up to tropopause levels.


Figure 3. Top: Zonal wind (westerly positive) and Bottom: meridional wind (southerly positive) from Paramaribo sonde observations
In general, it can be said that ECMWF model calculations resemble
quite well the meteorological features over Paramaribo. An interesting
feature is that ECMWF potential vorticity (PV) over Paramaribo
(cf. Fig. 4, bottom) shows negative values in the mid-upper troposphere,
coinciding with southerly meridional winds (cf. Fig. 3, bottom).
This indicates cross-equatorial transport of air from the Southern
Hemisphere, particularly in the mid-troposphere when the ITCZ
is to the south of Paramaribo (Dec-Mar). This is quite surprising,
as it means that the upper branch of the Hadley cell carries Southern
Hemisphere air northward and is therefore quite uncoupled from
the lower branch (north-east trade winds). During this period
(northern winter) negative PV-values also enter the stratosphere,
amplified in amplitude by the high vertical gradient in potential
temperature found in the stratosphere.


Figure 4. Top: Equivalent potential temperature calculated from Paramaribo
sonde observations, bottom: potential vorticity, from ECMWF calcuations
for Paramaribo.
It is of course curious why the negative PV-values are not more
abundant when the ITCZ is north of Suriname, and Paramaribo lies
meteorologically speaking in the Southern Hemisphere. It appears
that southerly flow in the lower troposphere and boundary layer
do not have the associated negative PV values, in contrast with
the middle and upper troposphere. This can be explained by the
fact that Paramaribo lies at 5.8°N, and air to the south-east
can still originate from north of the equator or around the equator
- all with small positive or almost zero PV-values. This is in
contrast with air higher up in the troposphere, where negative
PV-values correspond with back-trajectories that originate much
farther southward.
Summary
The annual cycle in total ozone and tropopause temperature are both tied to the intensity of the Brewer-Dobson circulation, modulated with a 30-50 day Madden-Julian oscillation. The maximum in total ozone does however also coincides with the Sun passing overhead in zenith during the dry season (6 September), which can be related to maximal photolysis of oxygen in the stratosphere. The MJO can be found in zonal wind at the tropopause, and also in the humidity levels of the lower troposphere. First studies, based on the equivalent potential temperature at the Earth surface, suggest an average upper limit of convection between 10-14 km. ECMWF calculations of potential vorticity over Paramaribo show negative values in the mid-troposphere, especially when the ITCZ lies to the south of Suriname. This indicates that the return flow of the upper Hadley branch does not come from the lower branch (north-east trade wind), but instead flows in from the Southern Hemisphere - suggesting a permeable ITCZ above about 7 km.
References
Madden, R.A. and P.R. Julian, 1972, Description of global-scale circulation cells in the tropics with a 40-50 day period, J. Atmos. Sci., 29, 1109-1123.
Plumb, R.A., and R.C. Bell, 1982, A model of the quasi-biennial oscillation of the stratospheric winds on an equatorial beta-plane, Quart. J. Roy. Meteor. Soc., 108, 335-352.
Van Weele, M., J.P.F. Fortuin and H.M. Kelder, 2000, Year-round spectral UV measurements at tropical Paramaribo, Suriname, this Proceedings issue.
Back to
| Session 1 : Stratospheric Processes and their Role in Climate | Session 2 : Stratospheric Indicators of Climate Change |
| Session 3 : Modelling and Diagnosis of Stratospheric Effects on Climate | Session 4 : UV Observations and Modelling |
| AuthorData | |
| Home Page | |