Laboratoire de Physique de l'Atmosphère, Université de la Réunion, France
Service d'aéronomie du CNRS, Paris, France
School of Pure and Applied Physics, University of Natal, Durban, South Africa
Abstract
Knowledge of mass exchange between different parts of the atmosphere is essential to understand the transport and distribution of long-lived atmospheric trace constituents, including ozone and atmospheric aerosols. It's also important for calculating the radiative budget and understanding the short- and long-term changes of anomalous phenomena, such as the "ozone hole" in the stratosphere over Antarctica.
To improve our understanding of the role of such transport processes, several co-ordinated project have been undertaken, such as the METRO project included in the THESIO program. Yet, due to the lack of ground-based measurements in the southern tropics and to the insufficient spatial and time accuracy of satellite data, investigations on transport across the southern boundary of the tropical stratospheric reservoir are not numerous.
We presently report the analysis of a laminae exchange from the tropics to mid-latitudes. Observations are based on LIDAR profiles of aerosol and temperature obtained at Durban (30°S, 32°E ; South Africa). PV laminae advection on isentropic surfaces is linked to aerosol profile increase through a high resolution model based on PV advection calculation using ECMWF meteorological analyses. Air masses are coming from the equatorial zone (nearly over Brazil), across the southern barrier of the tropical reservoir through laminae stretching and reach the southern subcontinent of Africa a few days later (5-6 days).
I. Introduction
Eddy transport barriers, resulting from the contribution of horizontal shear and isentropic gradient of PV, separate the tropical stratospheric reservoir from the mid-latitude stratosphere (Holton et al., 1995). Aerosol and trace gas steep gradients clearly materialise the edges of this reservoir (Grant et al., 1996). Sporadic disruptions of these barriers are occurring through planetary wave breaking and the generation of laminae. Yet, the height-latitude structure of dynamical and chemical tracer fields is complex and disruption mechanisms controlling the release of material between the tropics and mid-latitudes are still under study.
Moreover, the decrease of total ozone at the northern hemisphere middle latitudes is now well recognised (Scientific Assessment of Ozone Depletion : 1994, WMO, 1995). It is much larger in winter/spring (about 6% per decade) than in summer/autumn (3% per decade). It occurs mainly in the lower stratosphere. One possible cause of decrease in ozone concentration in the lower mid-latitude stratosphere is a change in the exchange rate of air between mid-latitudes and subtropics/tropics.
Knowledge of mass exchange between different parts of the atmosphere is then essential to understand the transport and distribution of long-lived atmospheric trace constituents, including ozone and atmospheric aerosols. It is also important for calculating the radiative budget and understanding the short- and long-term changes of anomalous phenomena, such as the "ozone hole" in the stratosphere over Antarctica.
Transport of air from troposphere to the stratosphere takes place mainly in the tropics. By studying satellite records of the dispersal of volcanic aerosols from tropical eruptions, Trepte and Hitchman (1992) concluded that there is a barrier inhibiting the transport of stratospheric air from the tropics to mid-latitudes. Thus, except for intrusions by planetary-scale waves and/or by tropospheric cyclonic-scale disturbances, the tropics are substantially isolated from the mid-latitudes throughout the lower stratosphere.
Randel et al. (1993) have suggested, through analyses of global maps of gas tracers obtained by the UARS experiments, that the transport from tropics to middle latitudes is similar to planetary wave erosion of the polar winter vortices, where material is pulled off the outer edge and mixed into mid-latitudes.
Similarly, transport out of the tropics occurs in Rossby wave breaking events in which filaments of tropical air are drawn into middle latitudes in the form of large-scale "tongues" through the surf zone.
In the present paper we report on a case study of an observed tropic/extra-tropic air mass exchange event detected by LIDAR through aerosol loading in the low stratosphere, and analysed by the use of ECMWF fields, a high resolution contour advection model and water vapour infrared satellite images.
II. Aerosol measurements by LIDAR
The present study has been undertaken thanks to LIDAR observations at Durban (30°S, 30°E), South Africa. That system has been implemented on the campus of the university of Natal in the frame of a bi-lateral French-South African co-operative research programme.
From the return signal back-scattered by successive atmospheric layers in the local troposphere and stratosphere, aerosol and temperature profiles can be derived, assuming that observed layers behave like a perfect gas in hydrostatic equilibrium (Hauchecorne and Chanin, 1980 ; Chazette et al., 1995). For that purpose our aerosol retrieval method is based on Klett inversion (Klett, 1981) that gives a convergent solution LIDAR equation and permit to obtain the Mie scatter ratio (total to molecular atmospheric back-scatter ratio) :
![]()
Molecular parameters are computed on the basis of ECMWF daily
fields.
The operating LIDAR at Durban is a Rayleigh-Mie system. The emitted beam is green, at 532 nm wavelength, and it is generated by a Nd:YAG pulsed laser with a repetition rate of 10 pulses per second. The receiver is made of two telescopes and two PhotoMultiplier detectors. LIDAR observations are thus made through two separate, but identical, channels. One channel is allocated to probe the troposphere. It uses the return signal collected by the smallest telescope, which total receiving surface is about 0.03 m?. The other channel has a total receiving surface of about 0.36 m?, and its observation field is directed to receive back-scatter photons from stratospheric layers. More information about instrumental details and temperature profile retrieval method and validation are given by Bencherif et al. (2000).
|
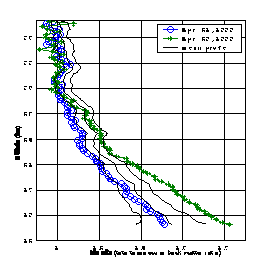
The LIDAR data set used in this study is made of daily records of back-scattered photons obtained over Durban during the period from April 21 to June 30, 1999. FIGURE 1 shows the derived Mie scatter ratio profile averaged over the studied period (over 28 profiles) and the corresponding standard deviations : Raverage(z) ± s In the lower stratosphere, the maximum value is obtained at the height of »18 km for Rmax »1.36. Above the 29 km height, all Mie scatter ratio values are in the neighbourhood of unity : at this altitude range, the atmosphere can be considered as typically molecular. On the same figure, we have superimposed Mie scatter ratio profiles
recorded on April 21st and 29th. By comparison, it comes that the 21st profile is similar to the averaged one, while the 29th profile indicates that, for altitudes lower than 22 km, the aerosol
back-scatter has significantly increased : R29(z=18 km) »1.56 (see FIGURE 1). FIGURE 1: : Mie scatter ratio profile averaged for period from April 21 to June 30 (over 28 profiles), obtained by LIDAR over Durban, superimposed to profiles recorded on April 21st and 29th (see legend) |
A similar aerosol profile is obtained the day after on April 30 (not shown), indicating the same pattern : an aerosol increase in the upper troposphere and the lower stratosphere.
Those LIDAR profiles suggest that by the end of April aerosol scatter has significantly and abnormally increased in the upper troposphere and the lower stratosphere as compared to the whole period results. That aerosol loading can be related to :
III. Analysis and discussion
III.1. Analyses from daily ECMWF assimilation
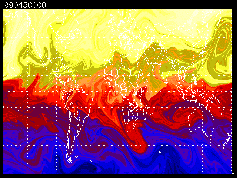
From examination of meteorological fields given on a daily basis by the ECMWF as derived for the 400 K potential temperature level (in the lower stratosphere), Potential Vorticity (PV) contours have been computed for the whole studied period (April 21 - June 30). FIGURE 2 shows the longitude´latitude cross-sections of the PV field obtained on April 21st and 29th.
One can note that, on the 29th, a large low-PV zone occurs and stands from 25° to 45°South and from 15° to 75° East : 2 £ PV £ 6 PVU. Its centre is situated around 30°S and between 28° and 44°E with the lowest PV values : PV £ 3 PVU. For comparison, the 21st PV map, which is representative of the studied period, indicates that expected PV values in the anomaly zone are about 8 PVU.
III.2. High resolution PV advection contours
In order to check about the origin of the increase, a high resolution advection model has been used for the period from 21 to 30 April. That model can produce a continuous evolution. The non-conservative terms of the large scale field are taken into account using a relaxation toward the ECMWF analysis. It has been used for real time 5 days forecasts of the PV fields and has been found useful for the sub-tropical and polar filaments detection and alert in the frame of the METRO project MEridional TRansport of Ozone in the lower stratosphere), a research project included in the European campaign THESEO (THird European Stratospheric Experiment on Ozone).

|
| FIGURE 2 : Potential Vorticity analyses derived from ECMWF fields, for the 400 K potential temperature level. By comparison with the 21st PV map (a), a large low-PV zone is well identified on the 29th (b). It stands from 25° to 45°south and from 15° to 75° east. |
Four PV maps derived for the 400 K level from ECMWF assimilation fields and taken between April 21st and April 30th, are presented on FIGURE 3. They show that a "tongue" of low-latitude, low-PV air has extended from tropics over the south American continent :
|
(a)
|
(b)
|
|
|
|
| FIGURE 3 : PV contours as obtained with a high resolution PV advection model for April (a) 23rd, (b) 25th, (c) 28th and (d) 30th. | |
Those PV contours are in favour of a tropical/extra-tropical mass exchange through filament events in a motion similar to the one produced by planetary-scale breaking waves in the stratosphere (Leovy et al., 1985 ; McIntyre and Palmer, 1983). In fact, it is the large-scale Rossby waves in the Westerlies that pull the tracer from tropics into mid-latitudes in the form of large-scale filaments through the surf zone (McIntyre and Palmer, 1984).
From analysis of the ECMWF zonal wind component (not shown) we have noted that the wind direction had changed in the upper stratosphere during the studied period: the zonal wind was getting westerly, what permitted to the Rossby planetary modes to propagate upward into the stratosphere. Besides, the LIDAR temperature profiles recorded over Durban reveal much variability from day to day (not shown). what highlights disturbances due to the planetary waves that propagate through the westerlies upward into the stratosphere in middle and high latitudes.
Moreover, when we examine the water vapour distributions in the troposphere, as revealed by satellite Infrared images (not shown), we note the presence of a convection event localised over Brazil on the 23rd.
In connection with the PV contours shown above (FIGURE 3), the observed convection event could be associated to a tropospheric source of aerosols, which may have been :
Examination of water vapour distributions in the troposphere (not shown) obtained on the 29th, shows that the tropospheric jet stream, which could have also induced a tropospheric-stratospheric exchange, was localised nearly in the middle of the Atlantic ocean, far from the south-western coast of Africa. What supports the suggestion that the observed aerosol loading event, that happened in the upper troposphere and lower stratosphere over Durban site, results meanly from a tropics/extra-tropics meridional air mass transfert.
IV. Conclusion
In the present paper, we have reported and analysed a case study of horizontal transport cross the southern subtropical barrier. That tropical/mid-latitude mass exchange event has been detected through aerosol profiles obtained by LIDAR over Durban, South Africa, by the end of April 1999. Daily ECMWF analysis, high resolution PV advection model and water vapour Infrared satellite images agree and suggest that the observed aerosol loading event in the upper troposphere and lower stratosphere over Durban is a result of a latitudinal air mass exchange from tropics into extra-tropics.
Acknowledgement
The authors wish to acknowledge the South African Weather Bureau for providing daily meteorological data, Prof. R.D. Diab (University of Natal, Durban, South Africa) for helpful comments and discussions. We also want to thank the French Embassy at Pretoria , the National Research Foundation (South African agency), le Ministère de l’éducation Nationale de l’Enseignement Supérieur et de la Recherche, le Ministère des Affaires Etrangères et de la Coopération and le Conseil Général de la Réunion, for their financial support.
References
Bencherif H., B. Morel, Moorgawa A., M. Michaelis, J. Leveau, J. Porteneuve, A. Hauchecorne, and D. Faduilhe, Observation and first validation of stratospheric temperature profiles obtained by a Rayleigh-Mie LIDAR over Durban, South Africa, South African Journal of Science, Nov. 2000 (in press)
Chazette, P., C. David, J. Lefrère, S. Godin, J. Pelon, and G. Mégie, Comparative lidar study of optical, geometrical, and dynamical propreties of stratospheric post-volcanic aerosols, following the eruptions of El-Chichon and Mount Pinatubo, J. of Geophys. Res., 100, D11, 23-195 / 23-207, 1995
Grant, W.B., Browell E.V., Long C.S., Stowe L.L., Graiger R.G., and Lambert A., Use of volcanic aerosols to study the tropical reservoir, J. of Geophys. Res., 101, 3973-3988, 1996
Hauchecorne, A, and M.L. Chanin, Density and temperature profiles obtained by lidar between 35 and 70 km, Geophys. Res. Lett., 565-568, 1980
Hauchecorne, A., A high resolution advection model for the interpretation of ozone filaments observed in lower stratosphere ozone lidar profiles at mid-latitudes, Procedings of Mesoscale Processes in the lower stratosphere, Bad Toelz, Germany, 9-11 November, 1998
Holton, J.R., P.H. Haynes, M.E. McIntyre, A.R. Douglass, R.B. Rood, and L. Pfister, Stratosphere-Troposphere Exchange, Reviews of Geophysics, 1995
Klett, J.D., Stable analytical inversion solution for processing lidar returns, Appl. Optics, 20, 2, 1981
Leovy, C.B., C.-R. Sun, M.H. Hitchman, E.E. Remsberg, J.M. Russel, L.L. Gordley, J.C. Gille, and L.V. Lyjak, Transport of ozone in the middle stratosphere : evidence for planetary wave breaking, J. Atmos. Sci., 42, 230-244, 1985
McIntyre, M.E., and T.N. Palmer, Breaking planetary waves in the stratosphere, Nature, 305, 593-600, 1983
McIntyre, M.E., and T.N. Palmer, The "surf zone" in the stratosphere, Journal of Atmos. And Terres. Physics, 46, n° 9, 825-849, 1984
Randel, W.J., Gille J.C., and Lahoz A.E., Stratospheric transport from tropics to middle latitudes by planetary wave mixing, Nature, 365, 533-535, 1993
Scientific Assessment of Ozone Depletion : 1994
Trepte, C.R., and Hitchman M.H., Tropical stratospheric circulation deduced from satellite aerosol data, Nature, 355, 626-628, 1992
Back to
| Session 1 : Stratospheric Processes and their Role in Climate | Session 2 : Stratospheric Indicators of Climate Change |
| Session 3 : Modelling and Diagnosis of Stratospheric Effects on Climate | Session 4 : UV Observations and Modelling |
| AuthorData | |
| Home Page | |