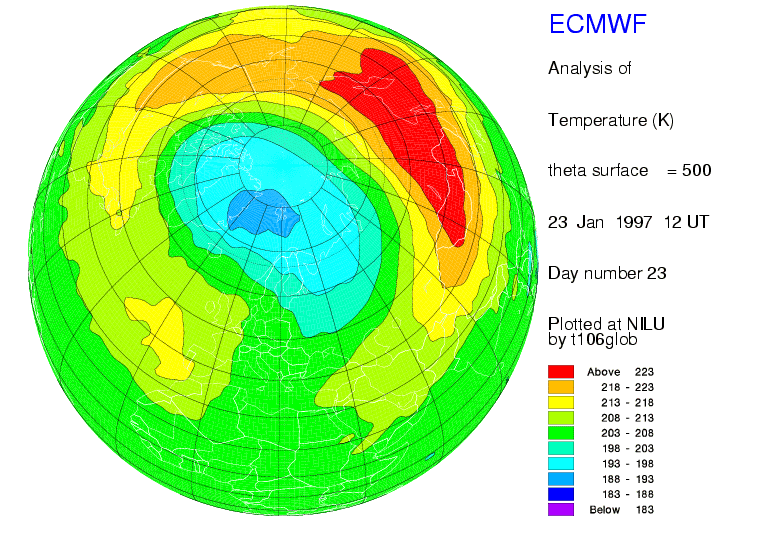
Fig.1: ECMWF-T106 500K temperature analysis for Jan.12, 1997, 12:00 UTC.
Previous: Introduction Next: Discussion Up: Ext. Abst.
2. Observations
2.1 Data
Aerosol backscatter and depolarisation LIDAR data from Sodankylä and Ny-Ålesund are used to distinguish between different observed PSC types. The Sodankylä LIDAR system was in use for the Stratospheric Aerosols and Ozone in the Northern and Southern Hemisphere (SAONAS) project during winter 1996/97, 1997/98 and 1998/99.
The LIDAR system in Ny-Ålesund is a part of the Network for the Detection of Stratospheric Changes (NDSC). Aerosol backscatter data are available in different wavelengths combinations from 1988/89 on.
2.2 Difference between the observations
Although the exact microphysical formation process of PSC is still not completely understood, PSC are known to form and exist under a certain threshold temperature TNAT (NAT=nitric acid trihydrate). The particle formation also depends on the cooling rate and the time period below TNAT. Taking these facts into account for the PSC observations above Sodankylä and Ny-Ålesund, obscurities still remain.
On several days, the large scale temperature field would have been sufficiently cold for PSC occurrence at both stations but PSC were only observed above Sodankylä, while Ny-Ålesund did not detect enhanced aerosol in the stratosphere. The same facts can be applied to water ice PSC (PSC type II) which exist below the threshold temperature TICE.
Apart from a local adiabatic cooling due to mountain wave activity in Northern Scandinavia, it is possible that PSC formation is modulated by vortex edge processes. While Ny- Ålesund is mostly in the centre, Sodankylä is located at the edge of the polar vortex. Subject of our case study is the effect of mesoscale vortex edge dynamics on PSC formation above Sodankylä.
2.3 Case Study
Due to the meteorological stratospheric conditions, January 1997
is best suited for a comparison between the two stations. As Sodankylä
is situated in the lee of the Scandinavian mountain ridge, lee-wave
induced PSC occurrence is often possible. To exclude lee-wave
activity, we chose Jan12, 1997, for our case study. According
to Dörnbrack et al., 2000, lee-wave activity is not likely on that day.

Fig.1: ECMWF-T106 500K temperature analysis for Jan.12, 1997, 12:00 UTC.

Fig.2: Radiosonde temperature profiles for Jan.12, 1997, 11:00 UTC, in
Sodankylä (blue line) and Ny-Ålesund (red line). Also shown are the threshold temperature
for TNAT (black), TSTS(dark grey) and TICE (light grey). The blue bars mark the observed PSC in Sodankylä
Nevertheless, we identify mesoscale effects concerning PSC occurrence.
The synoptic-scale ECMWF 500K temperature analysis shows similar
temperatures for Ny-Ålesund and Sodankylä (Fig.1). According to
the radiosonde temperature profiles (Fig.2) and the temperature along the backtrajectories (Fig.3), particle formation was theoretically possible in Ny-Ålesund
and less likely in Sodankylä. Still, during 14 hours of measurements
in Ny-Ålesund no PSC was detected. In contrast, the Sodankylä
LIDAR observed a PSC layer in 21 to 23 km altitude (500-550K)
and another layer in 25.5-26km.

Fig.3: Temperature along the 525K-backtrajectories for Jan.12, 1997,
12:00 UTC, ending in Sodankylä (blue line) and Ny-Ålesund (red line).
The difference between the two observation sites is their orientation
relative to the polar vortex. While Ny-Ålesund is in the centre,
Sodankylä is located at the edge of the polar vortex where filaments
of vortex air and mid-latitude air coexist on mesoscale spatial
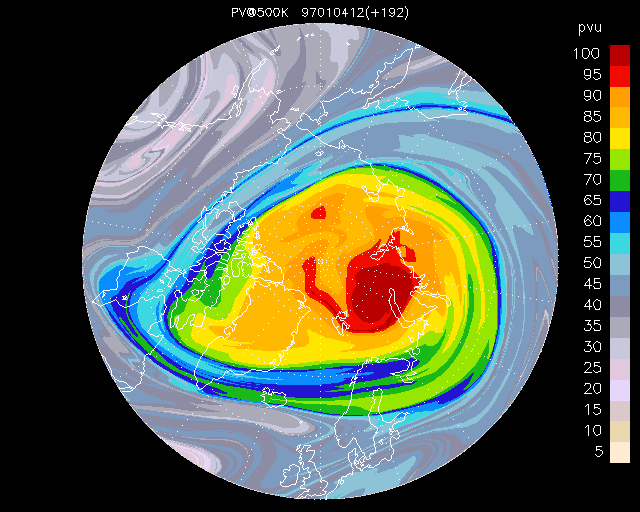
resolution. Fig.4 shows the 525K contour advection simulation
for the time of observation. Clearly, Ny-Ålesund is covered by
innermost vortex air, while Sodankylä is situated in an area of
mixed air masses. Here, mesoscale filaments with different properties could promote PSC
formation.

Fig.4: Contour advection simulation for Jan.4 + 192h 1997, on the 500K-surface. PV-units refer to Lait’s PV.