Previous:MIMOSA Simulations Next: Conditions for activation and transport Up: Ext. Abst.
Chemically activated air estimate
We have calculated the total amount of activated air with the MIMOSA scheme in order to evaluate the impact of the interannual difference. The condition of tracer greater than 0.5 as a threshold for the identification of the activated air has been used. The global amount of air accumulated outside the polar vortex has been estimated as the sum of the daily differences in surface of activated air. The sum has been calculated only during periods when surface was increasing using the approach given by Norton et al, 1995.
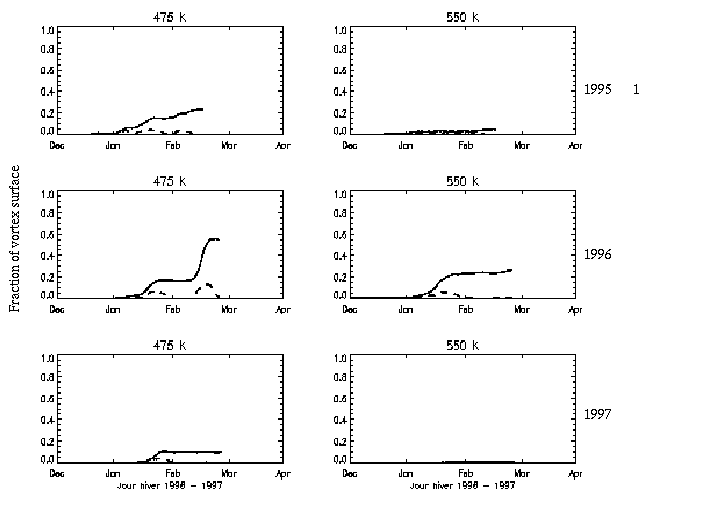
Both variables are reported in the figure 1 function of time for two isentropic levels, 475 K and 550 K where most of PSCs appeared during three winters. The interannual variability between 1994/1995, 1995/1996 winters and 1996/1997 winter is important. Up to 20 % of the vortex surface covered by activated air is present outside the polar vortex at both levels during the two first winters. The total amount of air activated is up to the 60 % of the average vortex surface during winter 1995/1996. We also observe that a filament formed during February 1996 at 475 (described in Fierli et al., 2000) is responsible for 60 % of the total surface of activated air. During winter 1996/1997 an isolate event during January at the 475 K levels leads to a total of 20 % of activated air. The periods of activation outside the polar vortex are in good agreement with PSCs measurements performed by the ALOMAR lidar.
Hadjinicolau et al. (1998) shown the role of PSCs activation on the extra vortex air during the same period studied here. Using a lower horizontal resolution model the highest contribution of activated air on ozone depletion to middle latitudes was evaluated at 20 % during 1995/1996.
Figure 1. Fraction of average polar vortex surface covered by chemically activated air (dashed line) and estimate of the activated air accumulated outside the polar vortex (plain line). The results are shown for three winters and two isentropic surfaces, 475 and 550 K