 |
Previous: Introduction Next: Total ozone amounts and trends Up: Ext. Abst.
2. Description of model and experiment performed
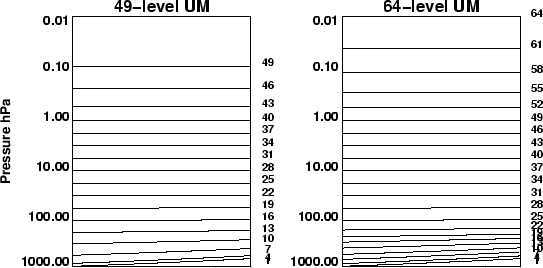
The Met. Office Unified Model (UM) (Cullen, 1993) is here used in extended form with 64 levels (upper boundary 0.01 hPa, Figure 1) and with a
|
latitude-longitude resolution of 2.5![]() by 3.75
by 3.75![]() . The model contains a complete range of stratospheric chemical
reactions allowing representation of all the main ozone formation
and destruction processes. The chemistry is also coupled to the
model radiation scheme. By resolving the whole of the stratosphere
and most of the mesosphere the model is able to simulate possible
dynamical feedbacks, such as changes in global mean meridional
circulation, important for ozone transport. Running on our local
massively parallel Cray T3E, the model takes about 40 hours per
model year using 36 processors. The model has undergone many improvements
(see Austin, 2000) since the earlier version of (Austin et al.,
2000a,b).
. The model contains a complete range of stratospheric chemical
reactions allowing representation of all the main ozone formation
and destruction processes. The chemistry is also coupled to the
model radiation scheme. By resolving the whole of the stratosphere
and most of the mesosphere the model is able to simulate possible
dynamical feedbacks, such as changes in global mean meridional
circulation, important for ozone transport. Running on our local
massively parallel Cray T3E, the model takes about 40 hours per
model year using 36 processors. The model has undergone many improvements
(see Austin, 2000) since the earlier version of (Austin et al.,
2000a,b).
Table 1. Long-lived tracer amounts used in the model simulations.
| Year (1 Jan) | 1980 | 1985 | 1990 | 1995 | 2000 | Notes |
| Cl |
1.63 | 2.21 | 2.72 | 3.26 | 3.53 | 1 |
| Br |
9.4 | 10.1 | 11.5 | 13.6 | 15.5 | 1 |
| Effective halogen (ppb) | 2.10 | 2.72 | 3.30 | 3.94 | 4.31 | 1,2 |
| NO |
18.4 | 18.6 | 18.8 | 19.1 | 19.4 | 3 |
| CFC11 (ppt) | 173 | 222 | 263 | 291 | 289 | 4 |
| CFC12 (ppt) | 295 | 382 | 477 | 532 | 545 | 4 |
| N |
302 | 306 | 310 | 314 | 319 | 4 |
| CH |
1603 | 1651 | 1700 | 1749 | 1810 | 4 |
| CO |
337 | 346 | 355 | 365 | 375 | 4 |
Previous: Introduction Next: Total ozone amounts and trends Up: Ext. Abst.