|
Stratospheric Processes And their Role in Climate
|
||||||||
| Home | Initiatives | Organisation | Publications | Meetings | Acronyms and Abbreviations | Useful Links |
![]()
|
Stratospheric Processes And their Role in Climate
|
||||||||
| Home | Initiatives | Organisation | Publications | Meetings | Acronyms and Abbreviations | Useful Links |
![]()
The SPARC Intercomparison of Middle Atmosphere Climatologies
William Randel, NCAR, Boulder, USA (randel@ucar.edu)
E. Fleming, NASA GSFC, Greenbelt, USA, M. Geller, SUNY, Stony Brook, USA, M. Gelman, NCEP, Washington, USA, K. Hamilton, IPRC, Honolulu, HI, USA, D. Karoly, Monash University, Melbourne, Australia, D. Ortland, NRA, Bellevue, USA, S. Pawson, NASA GSFC, Greenbelt, USA, R. Swinbank, UKMO, Bracknell, United Kingdom, P. Udelhofen, F. Wu , NCAR, Boulder, USA, M. Baldwin, NRA, Bellevue, USA, M.-L. Chanin, Service d’Aéronomie, Paris, France, P. Keckhut, Service d’Aéronomie, Paris, France, A. Simmons, ECMWF, Reading, United Kingdom, D. Wu, JPL, Pasadena, USASPARC has from its outset been concerned with “Stratospheric Indicators of Climate Change,” “Stratospheric Processes,” and “Troposphere/Stratosphere Modelling.” The SPARC project GRIPS (GCM Reality Intercomparison Project) has focused on comparing troposphere/stratosphere general circulation models (GCMs) with one another, both in terms of their technical formulations and in their results. Of course, another aspect of GRIPS is to examine how well model results compare to observations. Direct model/data comparisons are not so straightforward, however. For instance, the stratosphere displays a great deal of interannual variability, so that model-data comparisons necessarily include statistics of both means and variances over comparable time periods. Additionally , stratospheric data are obtained from complicated inversions of satellite-derived radiance measurements, from direct but sparse balloon or rocket measurements, from time continuous but geographically sparse ground-based remote sensing instruments, and finally from analysis of stratospheric measurements either by statistical techniques or from data assimilation methods. The climatologies derived by these different methods do not agree in all respects. Finally, the entire concept of stratospheric trends means that stratospheric climatology is itself time varying.
The SPARC Reference Climatology Group was established to update and evaluate existing middle atmosphere climatologies for use in GRIPS, and in other SPARC activities. Rather than create a single new “super climatology,” it was decided that a valuable contribution would be to (1) compile existing climatologies and make them easily available to the research community, and (2) carefully compare and evaluate the existing climatologies. The SPARC Data Center was established (in part) as a response to item (1), and an extensive Technical Report of intercomparisons (SPARC Report N°3, 2002) was compiled in response to item (2). SPARC (2002) includes detailed intercomparisons of a few basic and derived quantities, such as temperatures, zonal winds, and eddy flux statistics. Special attention is focused on tropical winds and temperatures, where large differences exist among separate analyses. SPARC (2002) also includes comparisons between the global climatologies and historical rocketsonde temperature and wind measurements, and also with more recent lidar temperature data. These comparisons highlight differences and uncertainties in contemporary middle atmosphere data sets, and allow biases in particular analyses to be isolated. This article presents a brief summary and some examples of the intercomparisons in SPARC (2002); for further details the reader is referred to the full report.
Background
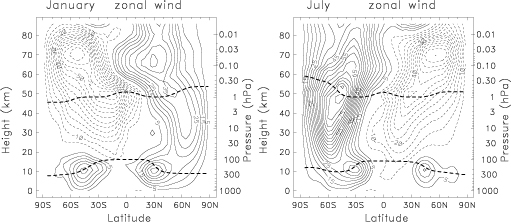
Current GCM simulations routinely extend into the middle atmosphere (50 km or higher), and require observational data sets for validation (e.g., Pawson et al., 2000). A number of middle atmosphere climatologies have been developed in the research community over the years, based on a variety of data sources and analysis techniques. The earliest comprehensive climatologies for the middle atmosphere were the 1964 and 1972 COSPAR reference atmospheres (CIRA), which were based largely on interpolation of single station balloon and rocket data. An updated version of CIRA in 1986 included early satellite observations of the stratosphere and mesosphere and has served as a community standard since that time. Around 1979, daily meteorological analyses with significant stratospheric coverage that included operational satellite temperature soundings began, and more recently sophisticated model-based data assimilation schemes began to produce stratospheric analyses. These analyses (supplemented in the 1990’s by extensive retrospective reanalyses) have served as the basis for some more recent middle atmosphere climatologies. Also, satellite observations from the Upper Atmosphere Research Satellite (UARS - launched in 1991 and continuing to operate in 2002) have provided additional climatological data sets for the middle atmosphere. An example of climatological zonal wind data (extending through the mesosphere) derived from UARS measurements is shown in Figure 1.
Figure 1. Climatological zonal mean zonal winds for January (left) and July (right), derived from the URAP data set (contour interval 5 m/s, with zero contours omitted). The heavy dashed lines denote the tropopause (taken from NCEP reanalyses) and stratopause (defined by the local temperature maximum near 50 km).
Data Sets
Details of the various stratospheric analyses included in the intercomparisons are described at length in SPARC (2002). Table 1 provides a summary and definition of acronyms used throughout this article. The simplest stratospheric analyses provide global or hemispheric fields based on hand-drawn analyses (FUB) or objective analysis gridding techniques (CPC and UKTOVS). More sophisticated analyses can be derived by the use of numerical forecast models to predict first-guess fields, and incorporate observations by optimal data assimilation (UKMO, NCEP, ERA15 and ERA40 data). Most of the analyses discussed below are based on very similar radiosonde and satellite data, and so the differences revealed in our comparisons highlight the sensitivity of the final statistics to details of the data usage and analysis techniques.
Table 1. Middle Atmosphere Data Sets included in the SPARC Intercomparisons Met Office Stratospheric Analyses Swinbank and O’Neill, 1994 Assimilation Nov. 1991-present Met Office TOVS Analyses UKTOVS Bailey et. al., 1993 Objective analysis Jan. 1979-Apr 1997 NCEP Climate Prediction Center Gelman et al., 1986 Objective analysis
(above 100 hPa)Oct. 1978-present NCEP reanalysis Kalnay et al., 1996 Assimilation 1948-present ERA15 reanalysis Gibson et. al., 1997 Assimilation 1979-1993 ERA40 reanalysis Assimilation 1957-2001 Berlin Stratospheric Analyses Labitzke and Naujokat, 1983 Hand analysis (NH only) 1964-2001 CIRA86 climatology Fleming et al., 1990 Various various (1960’s-1970’s) HALOE temperatures Russell et al., 1993 harmonic analysis of seasonal cycle 1992-2001 MLS temperatures Wu et al., 2002 Harmonic analysis of seasonal cycle Jan. 1992-Dec. 1994 UARS Reference Atmosphere Program zonal winds Swinbank and Ortland, 2002 UKMO and HRDI data Jan. 1992-Dec. 1998
The data intercomparisons here are based on a monthly climatology derived for the time period January 1992-December 1997, which gives direct overlap of the UKMO, CPC, NCEP and ERA40 reanalysis, and FUB fields. The UKTOVS record is slightly shorter (to April 1997). The ERA15 reanalysis has a much shorter record during this 1992-1997 period (January 1992-December 1993). We include comparisons for these data by calculating differences only over this 1992-1993 record, rather than the full 6 years 1992-1997. We also include comparisons with the CIRA86 climatology, although it should be kept in mind that these data are derived from a very different time period (covering the 1960’s-1970’s).
Two independent data sets are also included in the SPARC (2002) comparisons, namely historical rocketsonde wind and temperature measurements, and lidar temperature data. Measurements from meteorological rockets provide in situ wind and temperature data covering ~ 25-85 km. Rocketsonde observations span the 1960’s – 1990’s, but the majority of data occur during the 1970’s – 1980’s. The climatologies here are based on simple monthly averages, derived by binning all of the available observations during 1970-1989. Lidars provide measurements of the vertical temperature profile over ~ 30-75 km based on the Rayleigh lidar technique (Hauchecorne and Chanin, 1980; Keckhut et al., 1993). For the climatological analyses here, we obtained a number of lidar temperature time series (for stations with relatively long records) from the Network for the Detection of Stratospheric Change (NDSC) web site: http://www.ndsc.ws/ The individual profiles are binned into monthly samples, using all the lidar observations over 1990-1999.
Results: Temperature
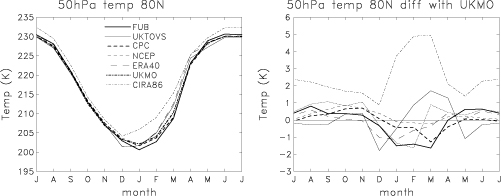
Comparisons of zonal mean temperature climatologies in the lower stratosphere show relatively large differences among analyses over (1) polar regions in winter and spring, and (2) near the tropical tropopause. As an example of the polar differences, Figure 2 compares the seasonal cycle of 50 hPa zonal mean temperature in the Arctic (80°N) from each data set, including a plot showing their respective differences from UKMO analyses (to quantify the relatively small difference values). The CIRA86 data exhibit warm biases by up to ~ 5 K in the Arctic (and ~ 10 K in the Antarctic; not shown here), maximizing during winter-spring in each hemisphere. A large portion of these differences probably reflect true cooling in the polar lower stratosphere between the 1960’s and 1990’s (e.g., Randel and Wu, 1999; Ramaswamy, 2001). Aside from CIRA86, the other climatologies agree to approximately ± 1 K in the Arctic (and ± 2 K in the Antarctic). Most analyses are colder than UKMO during Arctic winter in Figure 2, suggesting a small warm UKMO bias.
Figure 2. Left panel shows the seasonal variation of 50 hPa zonal mean temperature at 80&Mac176;N, and the right panels show the corresponding differences from UKMO analyses (i.e., CIRA86-UKMO, etc.).
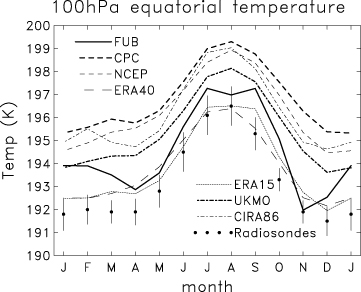
The seasonal variations of equatorial temperature at 100 hPa derived from each climatological data set are shown in Figure 3. Included in these figures are estimates of monthly temperatures derived for the same 1992-1997 time period from radiosonde measurements at a group of eight near-equatorial stations (within 5° of the equator). The amplitude of the seasonal cycle in temperature is reasonably well captured in most analyses at 100 hPa, but there are clear biases among the data sets. In particular, the ERA15, ERA40 and FUB data are the coldest and agree best with radiosondes (except for FUB during January-March), whereas UKMO, CPC, NCEP and CIRA86 data each have a consistent warm bias of ~ 2-3 K (and UKTOVS is almost 10 K too warm, and not shown in Figure 3).
Figure 3. Comparison of the seasonal variation in equatorial zonal mean temperature from available analyses at 100 hPa. The circles show a climatology derived from radiosonde measurements at eight near-equatorial stations (over 5°N-5°S), and the error bars denote plus/minus two sigma uncertainties of the corresponding monthly means.
>
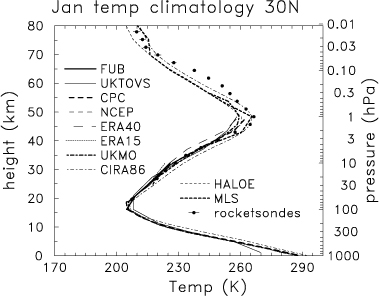
Figure 4 compares the vertical profile of zonal mean temperature at 30°N in January among all the analyses (up to 80 km), also including results from the rocketsonde climatology. While the overall profile is similar among the different data sets, there are relatively large differences near the stratopause (near 50 km). The stratopause level can present special problems in analyses, because the temperature maximum it is not captured accurately in the satellite thick layer radiance measurements, plus it is near the top of the UKMO forecast/assimilation model. The rocketsondes show good overall agreement in the stratosphere, and in locating the altitude of the stratopause. The rocketsonde temperatures in the mesosphere (~ 50-70 km) are warmer than the HALOE and MLS (and CIRA86) climatologies, and this is a typical feature that is at least partly due to the differing respective time periods.
Figure 4. Comparison of January average zonal mean temperature profiles at 30°N. Circles show rocketsonde statistics.
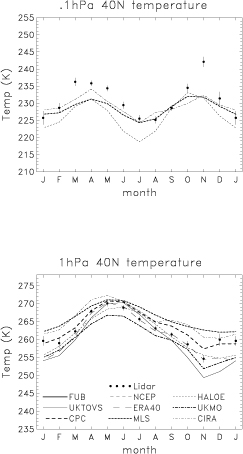
Lidar temperature measurements from the 1990’s are contemporaneous with the global analyses, and offer the most direct comparisons. Figure 5 shows a seasonal comparison of analysed zonal mean temperatures at 40°N for the 1 and 0.1 hPa levels, including results from the lidar climatology (lidar measurements from Table Mountain, OHP, Hohenpeissenberg and Toronto). The lidars fall in the mid-range of analyses at 1 hPa, and exhibit reasonably good agreement at 0.1 hPa (with a strong semi-annual variation). Note that because of the substantial variability evident in the lidars at 1 hPa (even during summer), they do not provide strong guidance in assessing uncertainties in the various analyses near the midlatitude stratopause.
Figure 5. Comparison of the seasonal variation of lidar temperatures near 40°N with zonal mean analyses, showing results at 1 and 0.1 hPa. Circles denote the lidar means, and error bars the plus/minus two standard error of the monthly means.
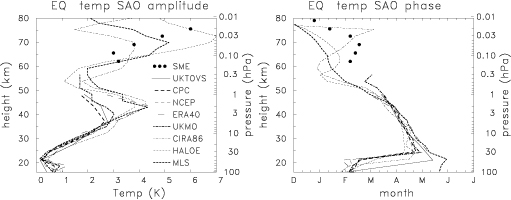
The semi-annual oscillation (SAO) dominates the seasonal variation in equatorial temperatures above the lower stratosphere, and it is useful to quantify the SAO amplitude and phase structures derived from the different data sets. The vertical structure of the temperature SAO amplitude is shown in Figure 6, including results from each data set. As well-known from previous analyses (e.g., Hirota, 1980), the temperature SAO has a double peaked structure in altitude, with maxima below the stratopause (~ 45 km) and mesopause (~ 70 km), and these maxima are approximately out of phase. The maximum near 45 km has an amplitude of ~ 4 K in MLS, HALOE, CIRA86 and ERA40 data sets, and substantially weaker amplitude in CPC, UKMO and UKTOVS data. For the maximum near 70 km the CIRA86, MLS and HALOE show a range of amplitudes of ~ 4-7 K. For further comparison of the upper level peak, the dots in Figure 6 show results derived from Solar Mesosphere Explorer (SME) temperature data for 1982-1986 (taken from Garcia and Clancy, 1990). These SME results show similar amplitude and phases as the other data sets, but don’t exhibit an absolute peak near 70 km.
Figure 6. Comparison of the amplitude of the semi-annual oscillation (SAO) in equatorial temperature derived from each data set. The dots show the mesospheric results derived from SME satellite data, taken from Garcia and Clancy (1990).
Zonal Winds
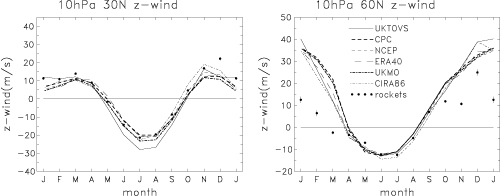
Seasonal climatologies of zonal mean zonal winds from the different data sets are compared in Figure 7, showing results at 10 hPa, for latitudes 30°N and 60°N. These comparisons also include results derived from rocketsondes, which provide direct measurements of zonal winds, and are unique for comparing to winds derived from analyses (given the caveat of differing time periods). The different analysis data sets are in reasonable agreement in Figure 7, and zonal winds agree well over most of the stratosphere outside of the tropics. The rocketsonde data show excellent agreement with analyses at 30°N, while at 60°N there are some systematic differences with rocketsondes during local winter (November-March), with weaker rocketsonde measurements. Given the good agreement with rocketsondes at 30°N (and at other locations), the observed differences at 60°N could be an effect of real (decadal-scale) time changes (with a stronger Arctic polar vortex during the 1990’s.
Figure 7. Comparison of the seasonal variation of 10 hPa zonal mean zonal winds from different analyses at 30°N (left) and 60°N (right), together with results derived from rocketsondes.
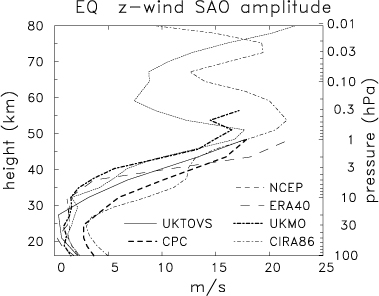
The SAO is a primary component of variability in tropical zonal winds above the lower stratosphere, and Figure 8 compares the vertical amplitude structure of the zonal wind SAO among the different data sets. The zonal wind SAO shows an amplitude maximum near the stratopause (~ 50 km), with reasonable agreement between various data sets. A second amplitude maximum near the mesopause (~ 80 km) is suggested in URAP and CIRA86 winds, but there are large differences in detail between the two data sets above 50 km.
Figure 8. Vertical profiles of the zonal wind semi-annual oscillation (SAO) amplitude at the equator derived from each available data set.
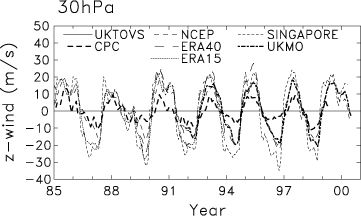
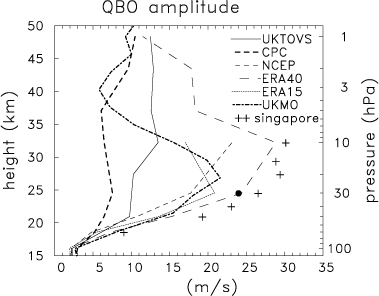
Figure 9 shows interannual anomalies in equatorial zonal wind at 30 hPa during 1985-1999 derived from the various analyses. The quasi-biennial oscillation (QBO) dominates variability in these time series, and included in Figure 9 are anomalies derived from Singapore radiosonde data, which are a standard reference for the QBO (e.g., Naujokat, 1986). The QBO signal is evident in each analysis, but the amplitude varies strongly between different data (and with altitude). In general the assimilated data sets (UKMO, NCEP, ERA15 and ERA40) have the largest amplitudes, and most closely approach the Singapore data, whereas the balance winds derived from CPC and UKTOVS are much too weak. The strength of the zonal wind QBO in the different data sets is quantified in Figure 10, where the equivalent QBO amplitude at the equator (defined, following Dunkerton and Delisi, 1985, as times the rms deviation of deseasonalised anomalies during 1992-1997) is plotted as a function of height. For comparison, Figure 10 also includes the 30 hPa QBO amplitude derived from Singapore radiosonde measurements over pressure levels 70-10 hPa. Overall the ERA40 data exhibit the largest QBO amplitude (in best agreement with the Singapore data), with the ERA15, UKMO and NCEP reanalyses somewhat weaker, and CPC and UKTOVS (derived from balance winds) as severe underestimates. Above 10 hPa there is a factor of two difference between the ERA40 and UKMO results, and here the UKMO data are almost certainly too weak.
Figure 9. Time series of interannual anomalies in equatorial zonal mean winds from various analyses and from Singapore (1°N) radiosonde measurements. Anomalies are calculated with respect to the 1992-1997 average.
Figure 10. Vertical structure of the equivalent QBO amplitude in zonal wind at the equator, defined as times the rms anomaly values during 1992-1997. For comparison, the 30 hPa result of Dunkerton and Delisi (1985) is included (dark dot), together with estimates from Singapore radiosondes (plus signs).
Outstanding uncertainties
This study has focused on comparing climatological data sets for the middle atmosphere that are currently used in the research community. Overall the climatologies developed from analyses (and lidar measurements) for the 1990’s agree well in most aspects, although each global data set can exhibit ‘outlier’ behaviour for certain statistics. SPARC (2002) includes a list of the largest apparent biases in each climatological data set, as derived from the intercomparisons.
Comparisons of the recent climatologies with the historical data sets (CIRA86 and rocketsondes) show reasonable overall agreement, but the effect of decadal-scale cooling throughout the middle atmosphere is evident, particularly uncertain. These are identified for statistics that show large variability among each of the different data sets, suggesting a fundamental level of uncertainty or high sensitivity to the details of data analysis.These include:
1) The tropical tropopause region is biased warm (compared to radiosonde data) in many analyses. Relatively smaller biases are found in the ERA15, ERA40 and FUB analyses, which are more strongly tied to radiosonde measurements. The warm biases in this region of sharp temperature gradients probably result from a combination of low vertical resolution in the analyses, plus the less than optimal use by most analyses of thick-layer satellite temperature measurements.
2) The temperature and 'sharpness' of the global stratopause shows considerable variability among different data sets. This is probably due to the relatively low vertical resolution of operational satellite measurements, and also the fact that the stratopause is near the upper boundary for several analyses (UKMO, CPC, UKTOVS).
3) Temperature variability in the tropics (associated with the QBO) is underestimated in all analyses (except FUB), compared to radiosonde measurements. The underestimates are particularly large for analyses that rely primarily on low resolution TOVS satellite data (CPC and UKTOVS). The temperature SAO near the stratopause is also underestimated in the CPC, UKMO and UKTOVS data sets.
4) QBO variations in zonal wind are underestimated to some degree in most analyses, as compared to Singapore radiosonde data. The best results are derived from assimilated data sets (ERA40, ERA15, UKMO and NCEP, in that order) and only ERA40 has realistic zonal wind amplitudes above 30 hPa. The use of balance winds in the tropics (derived from geopotential data alone) is problematic for the QBO.Acknowledgments
These climatological comparisons have resulted from work of the SPARC Reference Climatology Group, which has been ongoing since 1994. A majority of the work has centred on obtaining and archiving the numerous data sets in the SPARC Data Center. This activity was primarily organised by Dr. Petra Udelhofen, who unfortunately died during the final stages of preparation of the SPARC (2002) report. Petra was a valued friend and colleague of everyone involved with this project, and we dedicate it to her memory.
References
Bailey, M.J., A. O’Neill and V.D. Pope, Stratospheric analyses produced by the United Kingdom Meteorological Office, J. Appl. Meteorol., 32, 1472-1483, 1993.
Dunkerton, T.J. and D.P. Delisi, Climatology of the equatorial lower stratosphere, J. Atmos. Sci., 42, 376-396, 1985.
Dunkerton, T., D. Delisi and M. Baldwin, Examination of middle atmosphere cooling trend in historical rocketsonde data, Geophys. Res. Lett., 25, 3371-3374, 1998.
Fleming, E.L., S. Chandra, J.J. Barnett and M. Corney, Zonal mean temperature, pressure, zonal wind, and geopotential height as functions of latitude, COSPAR International Reference Atmosphere: 1986, Part II: Middle Atmosphere Models, Adv. Sp. Res., 10, N°12, 11-59, 1990.
Garcia, R.R. and R.T. Clancy, Seasonal variation of equatorial mesospheric temperatures observed by SME, J. Atmos. Sci., 47, 1666-1673, 1990.
Gelman, M.E., A.J. Miller, K.W. Johnson and R.N. Nagatani, Detection of long term trends in global stratospheric temperature from NMC analyses derived from NOAA satellite data, Adv. Sp. Res., 6, 17-26, 1986.
Gibson, J.K., et al., ERA description, Reanalysis Project Rept. 1, Eur. Center for Medium-Range Weather Forecasts, Reading, England, 1997.
Hauchecorne, A. and M.-L. Chanin, Density and temperature profiles obtained by lidar between 35 and 70 km, Geophys. Res. Lett., 7, 565-568, 1980.
Hirota, I., Observational evidence of the semiannual oscillation in the middle atmosphere: A review, Pure and Appl. Geophys., 118, 217-238, 1980.
Kalnay, E., et al., The NCAR/NCEP 40-year reanalysis project, Bull. Am. Meteorol. Soc., 77, 437-471, 1996.
Labitzke, K., and B. Naujokat, On the variability and trends of the temperature in the middle atmosphere, Beitr. Phys. Atmos. 56, 495-507, 1983.
Naujokat, B., An update of the observed quasi-biennial oscillation of the stratospheric winds over the tropics, J. Atmos. Sci., 43, 1873-1877, 1986.
Pawson, S., et al., The GCM-reality intercomparison project for SPARC (GRIPS): Scientific issues and initial results. Bull. Am. Meteorol. Soc., 81, 781-796, 2000.
Ramaswamy, V., et al., Stratospheric temperature trends: observations and model simulations, Rev. Geophys., 39, 71-122, 2001.
Randel, W.J. and F. Wu, Cooling of the Arctic and Antarctic polar stratospheres due to ozone depletion, J. Climate, 12, 1467-1479, 1999.
Russell, J.M., et al., The halogen occulation experiment, J. Geophys. Res., 98, 10,777-10,979, 1993.
SPARC Intercomparison of Middle Atmosphere Climatologies. SPARC Report No. 3, edited by W. Randel, M.-L. Chanin and C. Michaut, WCRP 116, WMO/TD 1142, December 2002.
Swinbank, R. and A. O’Neill, A stratosphere-troposphere data assimilation system, Monthly Weather Review, 122, 686-702, 1994.
Swinbank, R. and D. A. Ortland, Compilation of wind data for the UARS reference atmosphere project. J. Geophys. Res., 2002, submitted.
Wu, D.L., et al., Mesospheric temperatures from UARS MLS: Retrieval and validation, J. Atmos. Solar-Terr. Phys., submitted 2002.
![]()