Anomalous Sea Ice Conditions in the
Cosmonaut Sea during 1999
jump to current
conditions
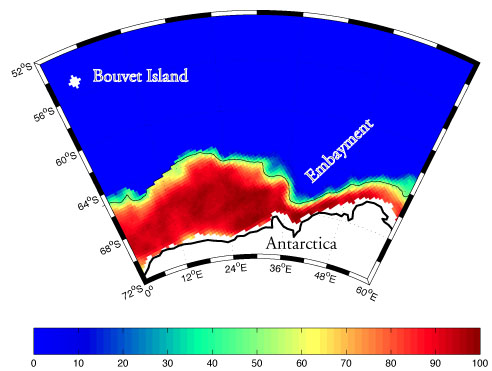
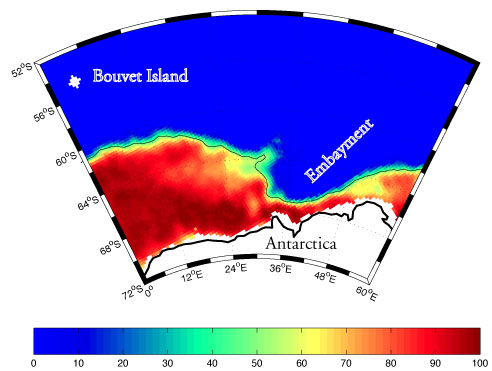
The embayment became noticable in late
May as sea ice to the west of the region expanded.
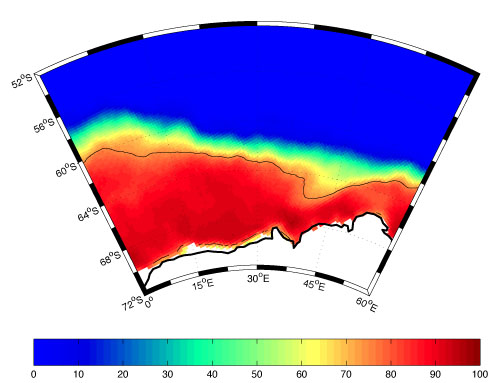
Average Ice Conditions for the period May
26 to 30 1999.
 How
to interpret the images
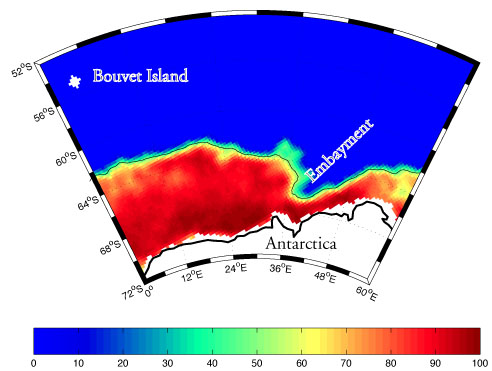
Comparisons with typical ice concentrations
show that with the exception of the embayment area, ice concentrations
in the area during this period in 1979 are heavier than usual.
How
to interpret the images
Comparisons with typical ice concentrations
show that with the exception of the embayment area, ice concentrations
in the area during this period in 1979 are heavier than usual.
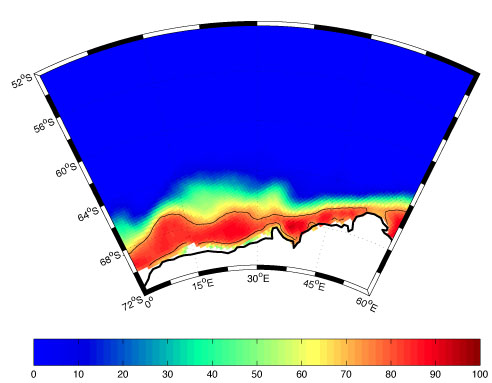
Climatological Ice Conditions for the period
May 26 to 30 (based on data from 1979-1998).
 How
to interpret the images
In early June as the sea ice expanded
outwards, the embayment became more pronounced.
How
to interpret the images
In early June as the sea ice expanded
outwards, the embayment became more pronounced.
Average Ice Conditions for the period June
5 to 9 1999.
 How
to interpret the images
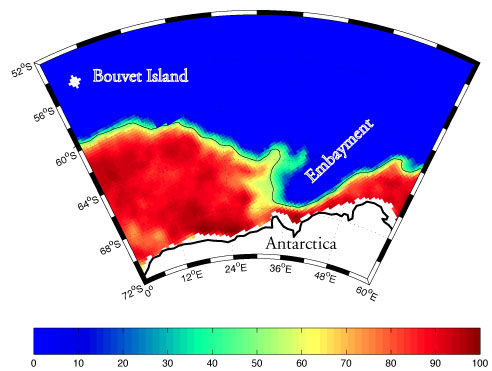
In mid June,
there was a remarkable growth in the
size of the embayment. This may be
a signature that oceanic convection was bringing warm water to
the surface in this region.
How
to interpret the images
In mid June,
there was a remarkable growth in the
size of the embayment. This may be
a signature that oceanic convection was bringing warm water to
the surface in this region.
Average Ice Conditions for the period June
15 to 19 1999.
 How
to interpret the images
By late June, there was consolidation
of the ice cover to the West and East of the now very well
pronounced embayment.
How
to interpret the images
By late June, there was consolidation
of the ice cover to the West and East of the now very well
pronounced embayment.
Average Ice Conditions for the period June
25 to 29 1999.
 How
to interpret the images
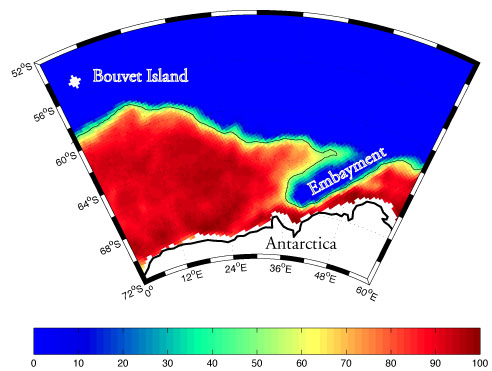
the embayment is still very pronounced.
It is remarkable that this region has been able to remain ice
free for over a month while the ice pack in the surrounding areas
continued its expansion. It strongly
suggests that convection in the ocean is acting to bring warm
water to the surface allowing sea surface temperatures in the
embayment to remain above freezing. There is some evidence
that it is now begining to become enclosed and may be undergoing
a transformation into a polynya.
How
to interpret the images
the embayment is still very pronounced.
It is remarkable that this region has been able to remain ice
free for over a month while the ice pack in the surrounding areas
continued its expansion. It strongly
suggests that convection in the ocean is acting to bring warm
water to the surface allowing sea surface temperatures in the
embayment to remain above freezing. There is some evidence
that it is now begining to become enclosed and may be undergoing
a transformation into a polynya.
Average Ice Conditions for the period July
5 to 9 1999.
 How
to interpret the images
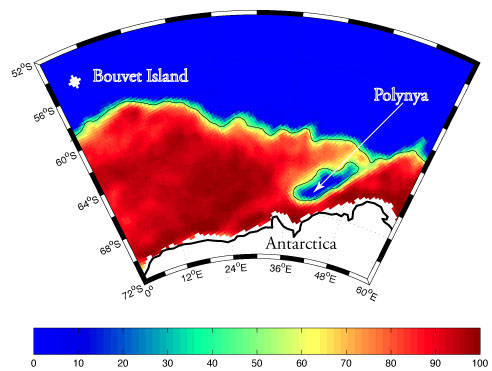
In mid July, the embayment has become
totally enclosed by sea ice resulting in the formation of a deep
ocean polynya.
The anomalous sea ice conditions and
the clouds over the polynya can also be seen on infra-red
satellite images
How
to interpret the images
In mid July, the embayment has become
totally enclosed by sea ice resulting in the formation of a deep
ocean polynya.
The anomalous sea ice conditions and
the clouds over the polynya can also be seen on infra-red
satellite images
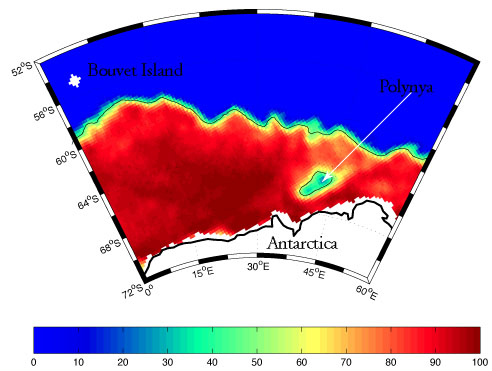
Average Ice Conditions for the period July
10 to 14 1999.
How
to interpret the images
Currently,
the deep ocean polynya covers an area of approximately
130,000 square kilometers.
The anomalous sea ice conditions and
the clouds over the polynya can also be seen on infra-red satellite images
Average Ice Conditions for the period July
15 to 19 1999.
How
to interpret the images
The sea ice distribution that currently
exists is remarkably different from the typical distribution at
this time of year.
Climatological Ice Conditions for the period
July 15 to 19 (based on data from 1979-1998).